Understanding the AI Bubble: Market Concentration, Valuations, and Diversification
Summary:
This video discusses investor concerns about a potential "AI bubble" driven by high US market concentration and valuations, offering historical context and protective strategies.
- The S&P 500's top seven stocks now account for 36% of its value, an unprecedented level of concentration since 1927.
- US stock market valuations are nearing 1999 dot-com peaks, which preceded a decade of flat returns.
- Historically, market bubbles driven by new technologies like railroads and the internet involved massive investment, high asset prices, and subsequent crashes.
- AI-related stocks have significantly contributed to recent S&P 500 returns, earnings growth, and capital expenditure since ChatGPT's launch.
- While market concentration has a weak link to future returns, high market valuations generally predict lower future returns.
- Diversification across different markets (e.g., global stocks) and within markets (e.g., value and small-cap stocks) has historically mitigated the impact of market crashes, as seen in the Canadian Nortel bust and Japan's lost decade.
- Investors should maintain diversification and discipline, accepting that portfolios will always contain both winners and underperformers.

US Stock Market Concentration in the Top 1, 3, 5, 7, and 10 Stocks (1927-2025) [ 00:00:20 ]
Concerns About the "AI Bubble" [0:00]
The video addresses growing investor worries about a potential "AI bubble," characterized by extreme market concentration and high valuations in the U.S. stock market.
Extreme Market Concentration [0:00]
- The S&P 500 index currently has 36% of its value concentrated in just seven stocks.
- The total U.S. market shows a 32% concentration in these top stocks.
- This represents the most extreme level of index concentration in U.S. market history, dating back to 1927.
US Stock Market Concentration in the Top 1, 3, 5, 7, and 10 Stocks (1927-2025) [ 00:00:20 ]
High Market Valuations [0:21]
- U.S. stock market valuations are approaching their 1999 dot-com bubble peaks.
- The 1999 peak was followed by a decade of flat U.S. stock returns.
- A significant decline in these highly valued, concentrated stocks could substantially impact the overall market.

Historic CAPE Ratio by Country (USA only) [ 00:00:30 ]
Historical Context of Bubbles [1:11]
The speaker clarifies that whether the current situation is an "AI bubble" is only discernible in hindsight but points to historical parallels.
The Nature of Stock Price Bubbles [1:49]
- Bubbles are periods of unusually high stock prices followed by much lower prices.
- They are often, but not always, triggered by new technologies promising huge profits.
- The history of technology bubbles dates back to at least the 1700s, following a similar pattern with each major technological innovation.

List of Historical Bubbles [ 00:02:00 ]
Productive Aspects of Bubbles [3:12]
- High stock prices fueled by speculation can facilitate the development and deployment of revolutionary technologies.
- Examples include the massive spending on fiber optic cables in the late 1990s and railway tracks in the 1840s.
- Despite the waste associated with bubbles (e.g., unused fiber optic cable, redundant railway track), essential infrastructure is created, potentially paving the way for economic growth.
- These "productive bubbles" are generally beneficial for the economy, even if they can be painful for individual investors.
The Cycle of Technological Bubbles [4:07]
- Investor excitement and high stock prices around technological revolutions follow a consistent pattern.
- Stock prices are driven by high profit potential and speculation.
- Eventually, prices revert, leading to low returns for those who bought near the peak.
- The rapid rise in prices of top U.S. stocks has been accompanied by substantial earnings growth, indicating some economic substance beyond pure hype.

US Corporate Profits as a Percentage of Nominal GDP [ 00:04:50 ] - Since the launch of Chat GPT in November 2022, AI-related stocks have accounted for:
- 75% of S&P 500 returns.
- 80% of earnings growth.
- 90% of capital spending growth.

JP Morgan Report Summary on AI's Impact on S&P 500 and US Construction Spending [ 00:05:00 ]
Lessons from Past Market Events [5:32]
The Nortel Example (Canada, 2000) [5:49]
- Nortel Networks, a telecommunications company, peaked at over 36% of the Canadian stock market index (TSSE 300) in July 2000.
- Canadian market valuations, influenced by Nortel, reached a Schiller CAPE ratio of 60.62, exceeding the U.S. dot-com peak.
- Nortel's downfall began with unprofitable acquisitions and was exacerbated by the dot-com bubble burst.

Historic CAPE Ratio by Country (USA vs. Canada) [ 00:06:39 ] - The TSSE 300 index dropped by 43% between September 2000 and September 2002.

Performance of $1,000 Invested in S&P/TSX Composite Index (Sept 2000 - July 2005) [ 00:07:49 ] - Recovery and Resilience:
- The market recovered by July 2005 and delivered strong returns despite the initial crash.
- Canadian value stocks did not crash and delivered stronger returns post-recovery.
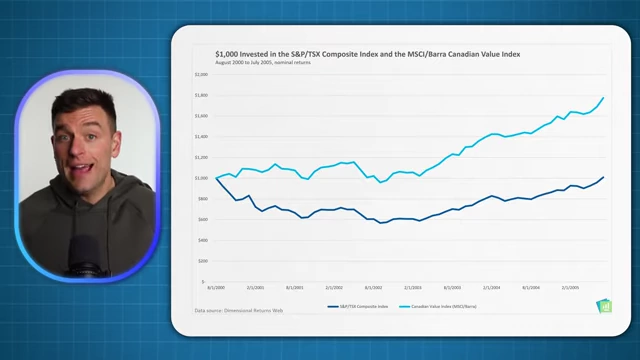
Performance of $1,000 Invested in Canadian Value Index vs S&P/TSX Composite Index (Aug 2000 - July 2005) [ 00:08:09 ]
The Dot-Com Bust (U.S., 2000s) [8:17]
- The U.S. market in 1999 had high stock prices, largely unjustified by fundamentals, though less extreme concentration than Canada's Nortel period.
- The dot-com bubble burst led to a "lost decade" for U.S. stocks.
- The S&P 500 remained flat or below flat until July 2013, a brutal period for investors who bought at the peak.
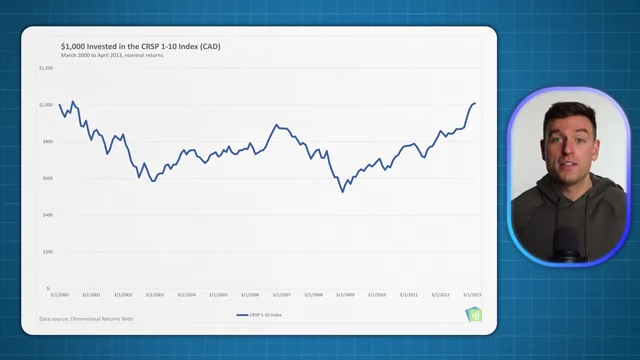
Performance of $1,000 Invested in CRSP 1-10 Index (US Market) (March 2000 - April 2013) [ 00:09:09 ] - Mitigating Factors:
- Investors in U.S. value stocks and small-cap value stocks fared much better, earning positive returns while the broader market was flat.

Performance of $1,000 Invested in US Value and Small Cap Value Stocks vs CRSP 1-10 Index (US Market) (March 2000 - April 2013) [ 00:09:39 ]
- Investors in U.S. value stocks and small-cap value stocks fared much better, earning positive returns while the broader market was flat.
The Japanese "Lost Decades" (1990s onward) [13:45]
- The Japanese stock market experienced a massive boom leading up to 1990, becoming the world's largest by market capitalization with exceptionally high valuations.
- The market crashed at the end of 1989 and has not recovered in real (inflation-adjusted) terms to this day.

Performance of $1,000 Invested in MSCI Japan Index vs Canadian Consumer Price Index (July 1989 - Nov 2025) [ 00:14:38 ] - Survival Strategies:
- Diversification across markets: A globally diversified investor would have done well as the U.S. market subsequently outperformed.
- Diversification within the Japanese market: Japanese value and small-cap value stocks performed adequately despite the overall market's struggles.

Performance of $1,000 Invested in MSCI Japan Index, MSCI World Index, and DFA Japan Small Cap Value Index (July 1989 - Oct 2025) [ 00:15:08 ]
Market Concentration vs. Valuations [10:01]
Market Concentration [10:01]
- Market concentration measures how much of the market's total value is held by a small number of stocks.
- The relationship between market concentration and future returns is statistically weak and economically noisy.
- Looking at U.S. market data from 1926, there's a slight negative correlation, but it's not statistically significant.

Relationship between US Market Concentration (Top 7 Weight) and 10-Year Market Returns (1926-2026) [ 00:10:31 ] - Many other global markets are more concentrated than the U.S. market, yet still deliver positive returns.
- Example: Taiwan, one of the most concentrated markets in November 2015, outperformed the U.S. market in the subsequent decade.

10-Year Returns and Starting Market Concentration for Various Countries (Nov 2015 - Nov 2025) [ 00:11:49 ] - Periods of falling concentration in the S&P 500 (post-1950) have seen less positive but not disastrous returns.

S&P 500 Annual Returns During Rising and Falling Concentration (1950-2023) [ 00:12:38 ]
Market Valuations (CAPE Ratio) [12:38]
- Market valuations (e.g., Schiller CAPE ratio) measure how expensive it is to buy expected future earnings.
- There is a clear monotonic relationship between starting CAPE ratio and future 10-year returns: higher starting valuations are associated with lower future returns.

Starting Schiller CAPE and Average Subsequent 10-Year Returns (10 Developed Markets 1982-2024) [ 00:13:38 ] - This relationship is economically strong, though statistically challenging to prove due to limited independent samples.
- High valuations do not guarantee an immediate crash, but they suggest moderating expectations for future U.S. market returns.
- The U.S. market has historically shown that high valuations can be followed by continued high returns, even if this is an unlikely outcome according to historical patterns.
Conclusion: Diversification and Discipline [17:15]
- The main lessons are diversification and discipline.
- A properly diversified investor should be comfortable with their portfolio through varying market conditions, accepting that it will always hold both winning and losing assets.
- The understanding that winners will outperform losers in the long run, and maintaining discipline, are crucial for long-term investment success.