This video argues that the government's Consumer Price Index (CPI) inflation reports are unreliable and consistently understate the true inflation rate, leading to a loss of purchasing power for millions of Americans.
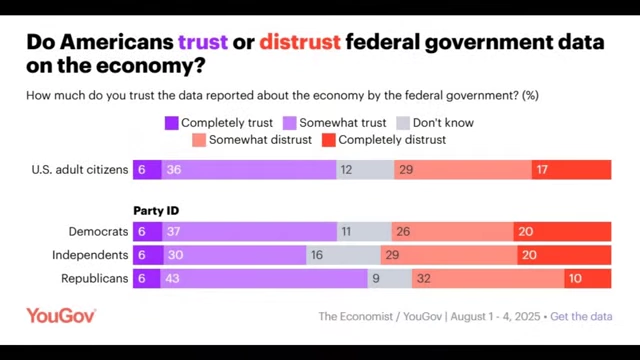
Only 6% of Americans completely trust federal government economic data, regardless of political affiliation.
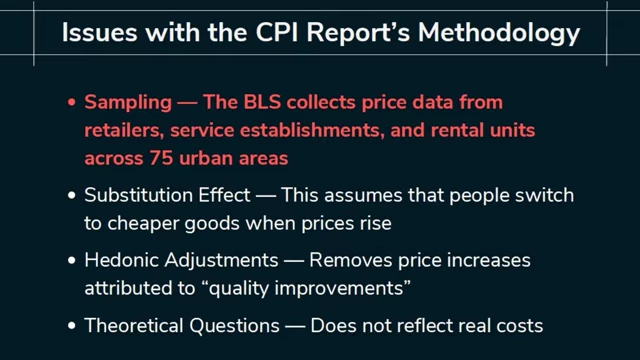
The CPI report's flawed methodology includes non-auditable sampling, the "substitution effect" (assuming switches to cheaper goods), "hedonic adjustments" (removing price increases due to "quality improvements"), and theoretical housing cost questions (Owner's Equivalent Rent) instead of real market rates.
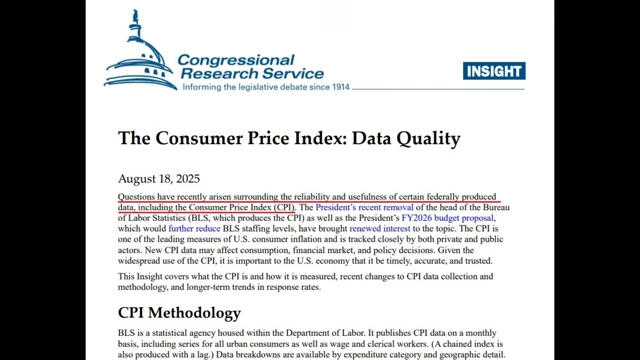
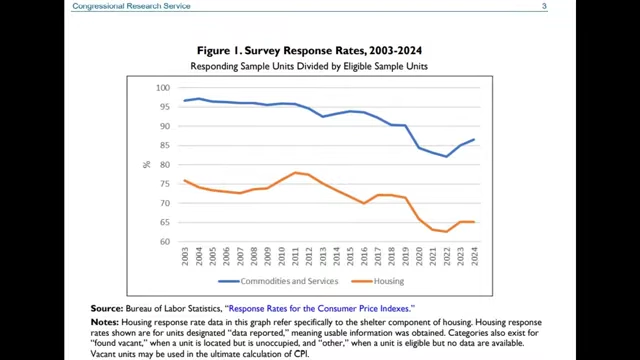
The Congressional Research Service also notes concerns about data reliability and declining voluntary survey response rates, which negatively impact data quality.
The speaker suggests the government is incentivized to underreport inflation to save money on Cost of Living Adjustments (COLA) for millions of Americans, reducing its financial obligations.
Alternative measures like M2 money supply growth and "True Living Cost" indicate significantly higher inflation than officially reported, effectively "stealing purchasing power."
Public distrust in federal government economic data, showing only 6% completely trust it across all party lines.
[
00:00:20
]
1. Introduction to CPI and Public Distrust [00:00:00]
The Consumer Price Index (CPI) inflation report is critical for various economic adjustments [00:00:45].
It affects Cost of Living Adjustments (COLA) for:
Social Security recipients.
Federal retirement programs.
VA benefits.
It impacts the tax code, including:
Standard deduction adjustments.
Tax brackets.
Retirement plan contribution limits.
Earned Income Tax Credit (EITC).
It influences wages and labor contracts, particularly union agreements and minimum wage laws in many jurisdictions.
Public trust in federal government economic data is notably low [00:00:21].
A YouGov survey reveals only 6% of U.S. adult citizens completely trust the government's economic data.
This low level of trust is consistent across different political affiliations (Democrats, Independents, Republicans).
The speaker contends that the government systematically underreports the true rate of inflation [00:01:20].
A YouGov survey reveals that only 6% of U.S. adult citizens completely trust federal government data on the economy, with similar skepticism across political party lines.
[
00:00:20
]
2. Methodological Issues with the CPI Report [00:01:31]
The CPI's core objective is to measure "the change in the cost of maintaining the same standard of living," which is highly subjective and allows for manipulation, rather than simply measuring the change in prices of goods [00:02:01].
This method assumes that consumers will switch to cheaper goods or services when the prices of preferred items rise.
For example, if tangerine prices increase significantly, the CPI might assume consumers switch to grapefruits, effectively understating the actual inflation for tangerines.
The speaker argues this effect consistently understates the true rate of inflation.
This controversial adjustment removes price increases attributed to "quality improvements" from the inflation calculation.
For instance, if a smartphone's price doubles over five years, the CPI might claim no inflation occurred because the newer phone has "better features," attributing the price difference solely to perceived quality enhancements rather than increased cost.
D. Theoretical Questions for Housing Costs [00:05:01]
Housing accounts for approximately 33% of the CPI.
A significant portion of this is based on "owner's equivalent rent," where homeowners are asked theoretically how much they would expect to pay to rent their own home.
This relies on subjective opinions rather than hard data or real market rental rates, leading to inaccurate reflections of actual housing cost inflation.
A summary of the core issues identified with the CPI report's methodology, including sampling, the substitution effect, hedonic adjustments, and theoretical questions.
[
00:02:25
]
3. Congressional Concerns and Declining Data Quality [00:05:35]
The Congressional Research Service has raised "questions...surrounding the reliability and usefulness of certain federally produced data, including the Consumer Price Index" [00:05:40].
CPI surveys are voluntary, and response rates have been exhibiting a downward trend over many years, accelerating during the pandemic.
Lower response rates are associated with lower data quality and precision.
Graphs show a significant decline in response rates for both commodities/services and housing from 2003 to 2024, indicating deteriorating data quality.
The speaker suggests the government should automate price collection by using internet data and disclose the data for public auditability, which would enhance transparency and trust.
The Congressional Research Service report highlighting concerns about the reliability and usefulness of federally produced data, including the CPI.
[
00:05:50
]
A graph illustrating the declining trend in survey response rates for commodities, services, and housing components of the CPI from 2003 to 2024, indicating a decrease in data quality.
[
00:06:34
]
4. Incentives for Underreporting Inflation [00:08:02]
The primary incentive for the government to underreport inflation is financial savings [00:08:09].
If the government reported the true rate of inflation, it would have to pay significantly more in COLA to programs like Social Security.
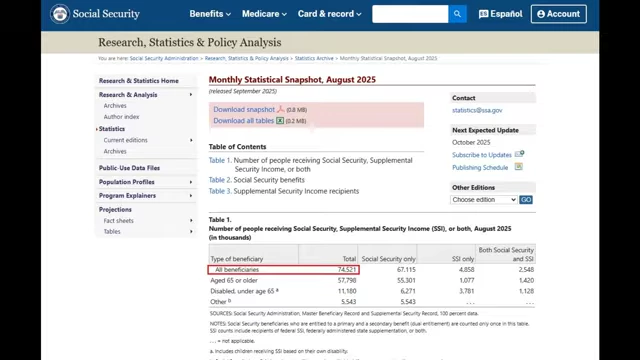
With 74.5 million Americans receiving Social Security benefits, accurate COLA would lead to massive increases in government expenditures.
Increased payments would necessitate more government borrowing, driving up interest payments even faster.
This financial impact extends to millions of other Americans whose benefits and wages are tied to CPI.
A Social Security Administration table showing 74.5 million total beneficiaries, underscoring the vast number of people affected by COLA calculations.
[
00:08:30
]
5. Alternative Perspectives on Inflation [00:08:58]
Comparing reported CPI to other measures reveals significant disparities.
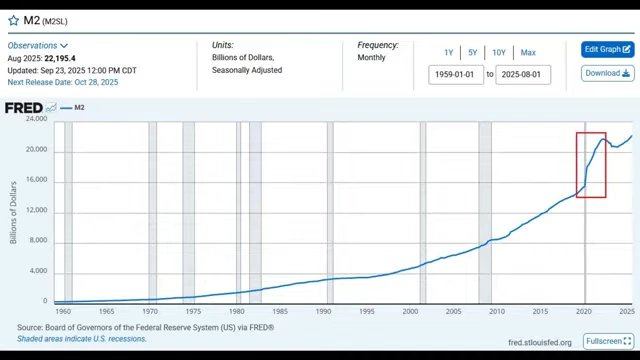
The M2 money supply is currently growing at a rate of 5%, whereas the reported CPI inflation is around 3%. This 2% difference represents a substantial underreporting.
During the pandemic, the M2 growth rate was even more pronounced (e.g., 15%), while reported CPI was much lower (e.g., 8%), indicating a larger discrepancy.
This consistent underreporting leads to a compounded loss of purchasing power for citizens over time.
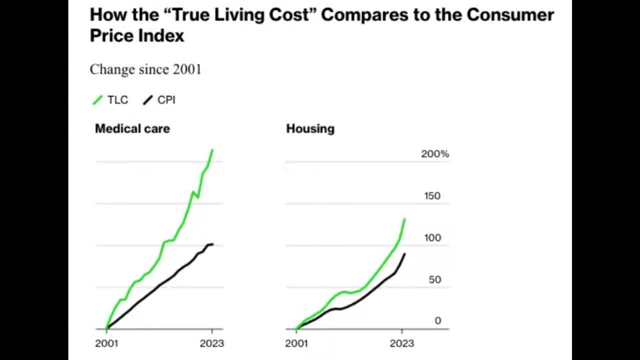
Other measures, such as the "True Living Cost" (TLC) and Shadow Stats, suggest that real-life expenses are rising much faster than the government's official CPI figures.
Graphs comparing TLC and CPI for categories like medical care and housing show that TLC has increased at a significantly higher rate since 2001, reflecting a greater erosion of purchasing power than officially acknowledged.
The speaker concludes that the government's underreporting of inflation is effectively "stealing our purchasing power."
A FRED graph showing the M2 money supply in billions of dollars from 1959 to 2025, with a red box highlighting the sharp increase around 2020.
[
00:09:38
]
Graphs comparing "True Living Cost" (TLC) and CPI for medical care and housing from 2001 to 2023, illustrating that TLC shows a much faster rise in expenses than the official CPI.
[
00:07:13
]