How Power Laws Shape the World: Beyond Normal Distributions in Critical Systems and Life Strategy
Summary:
This video explains power laws, contrasting them with normal and log-normal distributions.
- Normal distributions describe phenomena like height, where values cluster around an average and extreme outliers are rare.
- Log-normal distributions arise from multiplicative random effects, showing a long tail of rare, large outcomes.
- Power laws are distinct, characterized by a lack of intrinsic scale, infinite standard deviation, and averages dominated by extreme outliers. They are evident in income distribution, earthquake sizes, and forest fires.
- Self-Organized Criticality (SOC) explains how complex systems naturally evolve into a critical state, producing power-law distributed events of all sizes from small, identical causes.
- Universality classes group systems that behave identically at critical points, allowing simple models (like sandpiles) to predict complex phenomena (like earthquakes).
- Strategic implications differ between normal and power-law dominated systems. In power-law environments (e.g., venture capital, creative industries), success relies on making multiple "risky" bets, as one massive outlier can offset many failures.
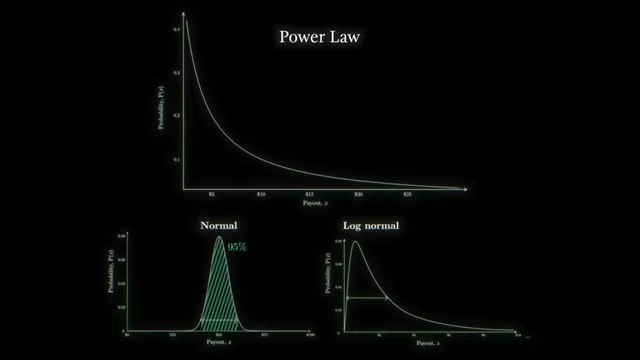
Comparison of Power Law, Normal, and Log-Normal distributions [ 00:10:39 ]
What is a Power Law? [0:00]
The world often presents distributions that are not "normal," where data clusters around an average, like human height or apple size.
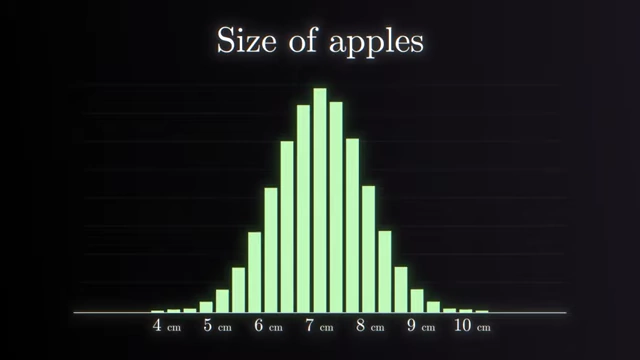
- Normal Distribution Explained [0:00]
- Most data points are near the average value.
- Extreme outliers are statistically very rare and virtually impossible (e.g., someone five times the average height).
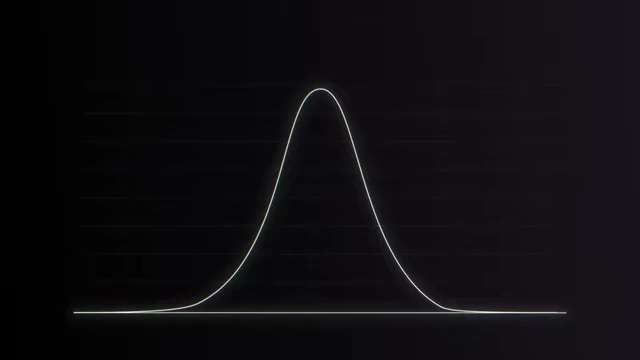
A typical normal distribution curve [ 00:00:13 ]
- Vilfredo Pareto's Discovery (Income Distribution) [1:10]
- In the late 1800s, Pareto analyzed income tax records from various European countries.
- He found a consistent pattern where a small percentage of people earned significantly more than others.
- This pattern was not a normal distribution; it showed a long tail of high earners.
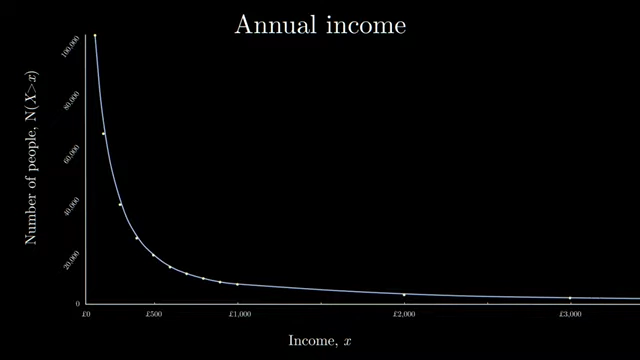
Annual income distribution showing a long tail of high earners [ 00:02:00 ] - To visualize this spread, Pareto used a log-log plot.
- This transformed the broad, slowly declining curve into a straight line.
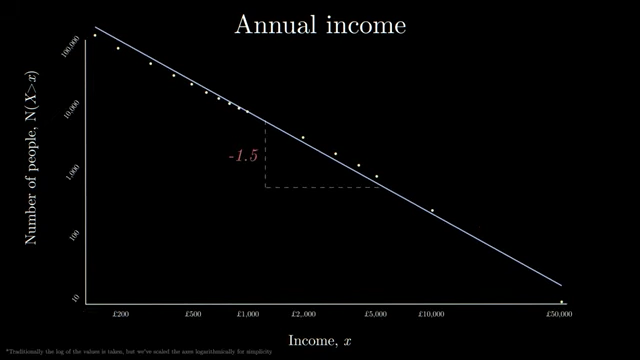
Log-log plot of annual income, transforming the curve into a straight line with a gradient of -1.5 [ 00:02:40 ] - The gradient of this line (e.g., -1.5 for England) revealed a specific mathematical relationship.
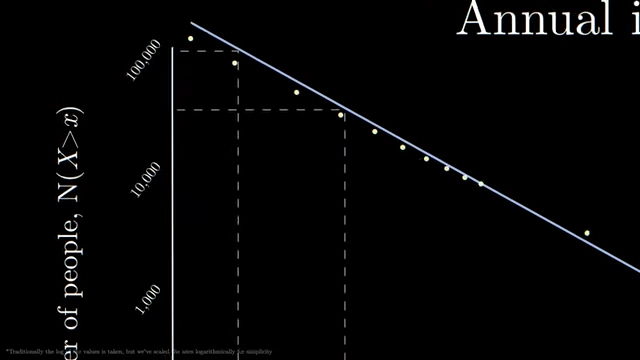
Log-log plot illustrating how doubling income leads to a specific drop in the number of earners, demonstrating the power law [ 00:02:48 ] - Equation: The number of people earning an income greater than or equal to X is proportional to 1/X to the power of 1.5 (N(X>x) ∝ 1/x^1.5).
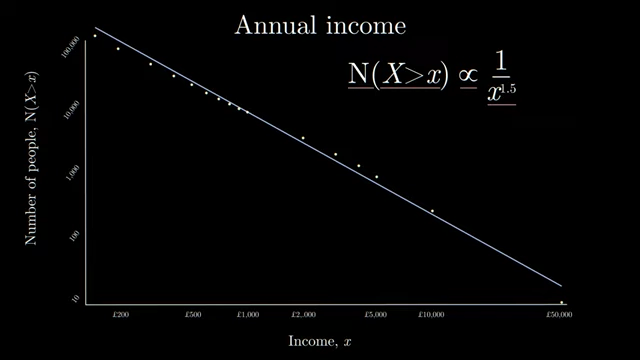
The power law equation N(X>x) ∝ 1/x^1.5 derived from annual income data [ 00:03:10 ]
- This transformed the broad, slowly declining curve into a straight line.
- This type of relationship is called a power law.
- Similar patterns were observed across multiple countries.
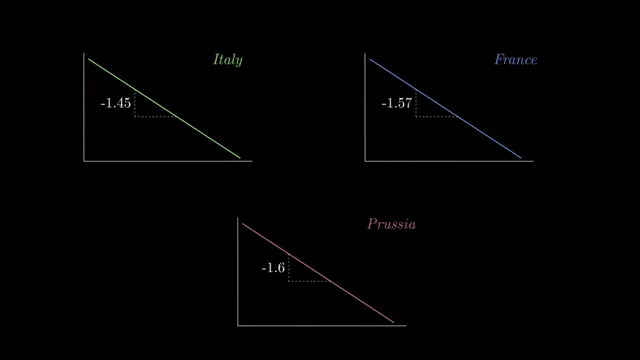
Log-log plots of income distribution for Italy, France, and Prussia, showing similar power law gradients [ 00:03:28 ]
- To visualize this spread, Pareto used a log-log plot.
Expected Values [4:31]
To illustrate the dramatic differences between normal, log-normal, and power law distributions, three coin games are presented.
- Game 1: Additive Wins (Normal Distribution) [3:57]
- 100 coin tosses, win $1 for each head.
- Expected payout: $50 (1/2 probability * $1 * 100 tosses).
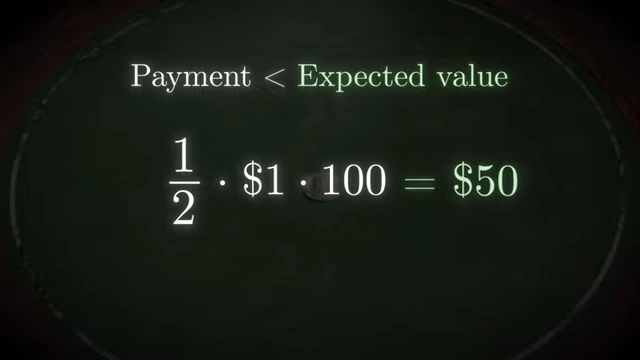
Calculation of expected payout for Game 1, resulting in $50 [ 00:04:24 ] - If played repeatedly, actual payouts would cluster around $50, forming a normal distribution.
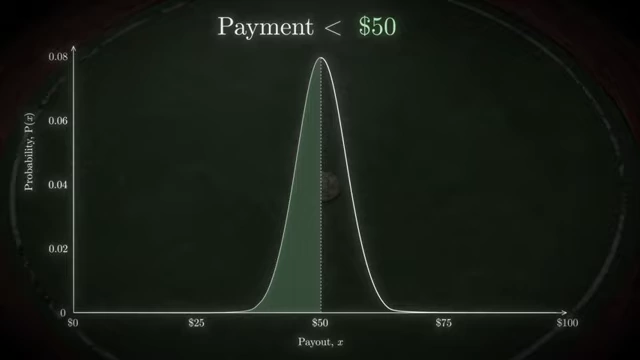
Probability distribution of payouts for Game 1, showing a normal curve centered at $50 [ 00:04:30 ] - This reflects situations where many random, independent effects add up.
- Abraham de Moivre first studied such problems in the 1700s.
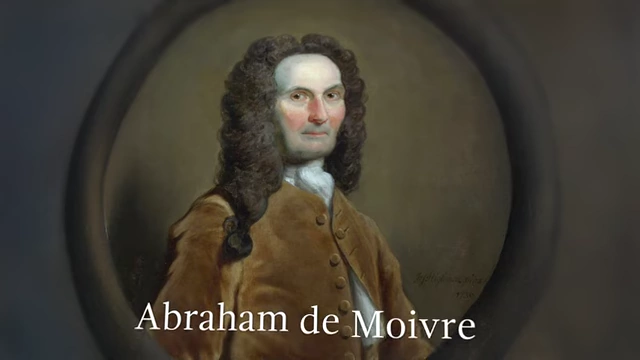
Abraham de Moivre, early 18th-century mathematician who studied probability distributions [ 00:04:41 ] 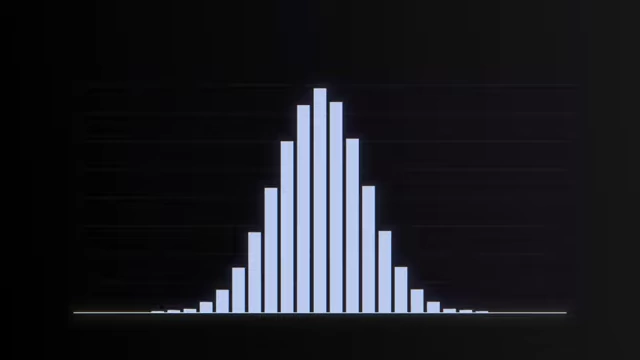
Bar chart representing a normal distribution [ 00:04:48 ]
- Game 2: Multiplicative Wins (Log-Normal Distribution) [5:14]
- Start with $1. Multiply by 1.1 for heads, 0.9 for tails, over 100 tosses.
- Expected factor per turn: (1.1 + 0.9) / 2 = 1.
- Expected payout over 100 tosses: $1.
- However, the distribution of payouts is asymmetric, with a long tail of very large wins (e.g., $1.1^100 ≈ $14,000 for 100 heads).
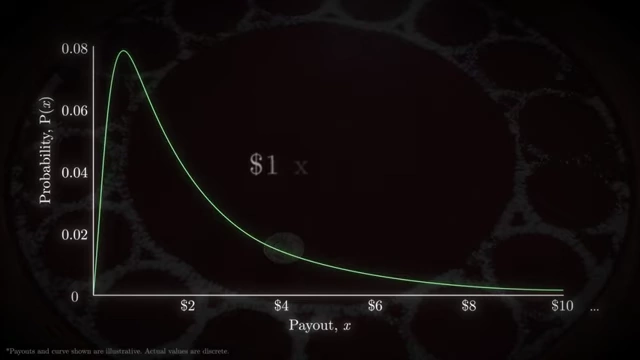
Probability distribution of payouts for Game 2, illustrating an asymmetric log-normal curve with a long tail [ 00:06:20 ] - The median payout is around $0.61.
- On a logarithmic x-axis, this distribution appears as a normal curve, hence "log-normal."
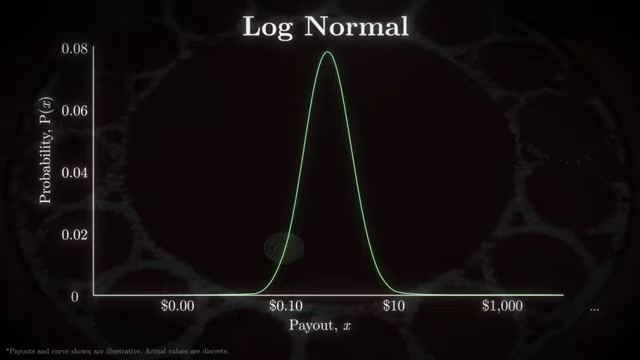
Log-normal distribution which appears as a normal curve on a logarithmic x-axis [ 00:06:59 ] - This happens because multiplying random effects is equivalent to adding their logarithms.
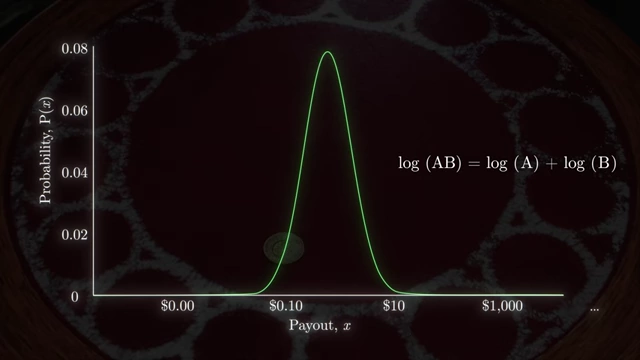
Mathematical property showing that the logarithm of a product is the sum of the logarithms, explaining log-normal distributions [ 00:07:25 ]
- Log-normal distributions arise when random effects multiply, leading to significant inequalities and a higher likelihood of very big events compared to a normal distribution.
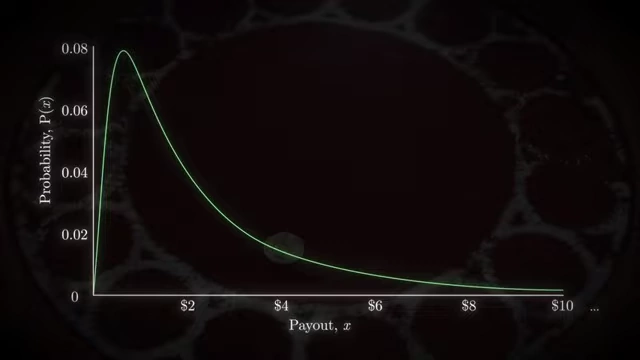
Log-normal distribution with its characteristic long tail indicating a high likelihood of very large events [ 00:07:43 ]
The St. Petersburg Paradox [8:49]
- Game 3: Doubling Payout Until Heads (Power Law) [8:05]
- Start with $1. Payout doubles with each tails, until a head ends the game.
- Example: Heads on 1st toss = $2. Tails then Heads = $4. Two Tails then Heads = $8, and so on (2^n dollars for n tosses).
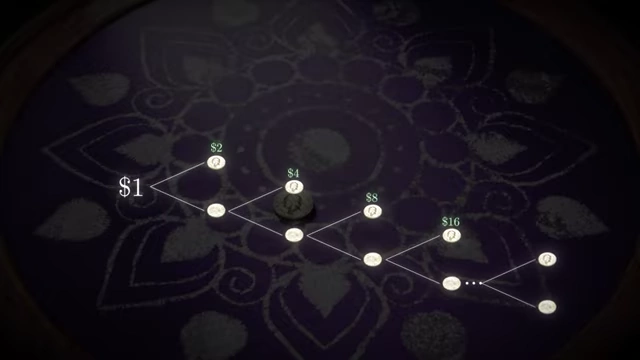
Tree diagram illustrating payouts and probabilities in the St. Petersburg Paradox, showing exponential growth of payout and decay of probability [ 00:08:29 ] - Expected Value Calculation: Each possible outcome (Heads, TH, TTH, etc.) contributes $1 to the expected value ($2 * 1/2 + $4 * 1/4 + $8 * 1/8 + ... = $1 + $1 + $1 + ...).
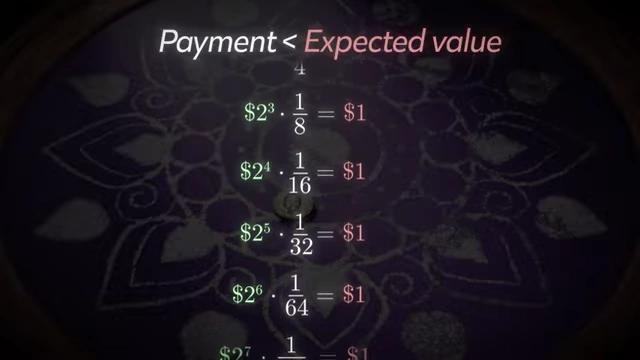
Calculation of expected values for St. Petersburg Paradox outcomes, each contributing $1 [ 00:09:19 ] - The Paradox: Theoretically, the total expected value of this game is infinite.
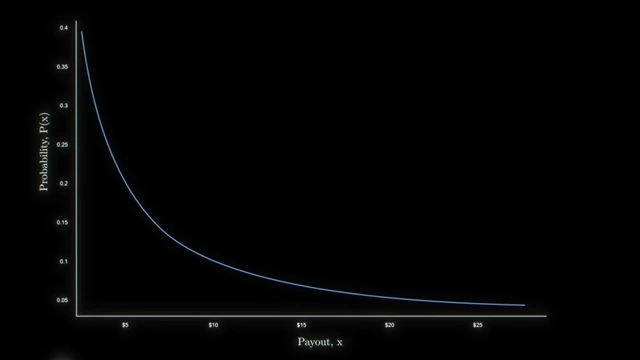
Probability distribution of payouts in the St. Petersburg Paradox, showing an uncapped, long-tailed curve [ 00:09:49 ] - Power Law Connection: When plotted on a log-log scale, the probability distribution of payouts in the St. Petersburg paradox forms a straight line with a gradient of negative one.
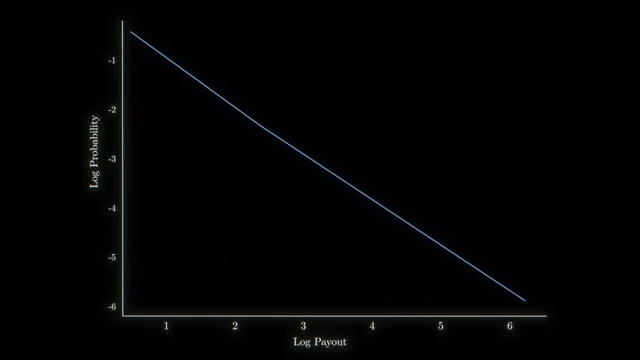
Log-log plot of the St. Petersburg Paradox payout probabilities, forming a straight line with a gradient of negative one (P(x) = x^-1) [ 00:10:09 ] - This specific power law is P(x) = x^-1 (or 1/x).
- Unlike normal and log-normal distributions, the St. Petersburg paradox's power law has an infinite standard deviation, meaning there's no characteristic "width" to the distribution.
Comparison of Power Law, Normal, and Log-Normal distributions [ 00:10:39 ]
Outliers Dominate Averages [11:37]
- Non-Converging Averages: When dealing with power law distributions, a rolling average of repeated trials will not converge; it will continue to increase as more extreme (and rare) outliers are encountered.
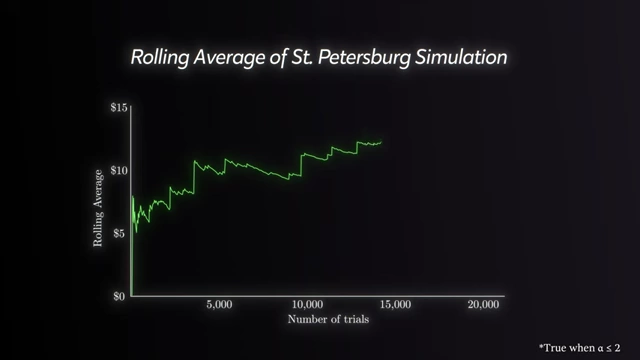
Graph showing the rolling average of a St. Petersburg simulation, demonstrating that the average does not converge due to extreme outliers [ 00:11:03 ] 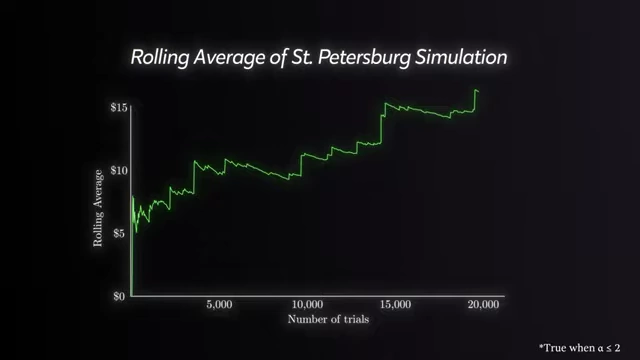
Rolling average of the St. Petersburg simulation continuing to increase with more trials, influenced by rare large events [ 00:11:09 ] - Impact of Outliers: A single extreme outlier can disproportionately influence the overall average (e.g., the average wealth in a room with a billionaire).
- Power laws often result from two underlying exponential processes conspiring together.
- An example is earthquakes: their frequency decreases exponentially with magnitude.
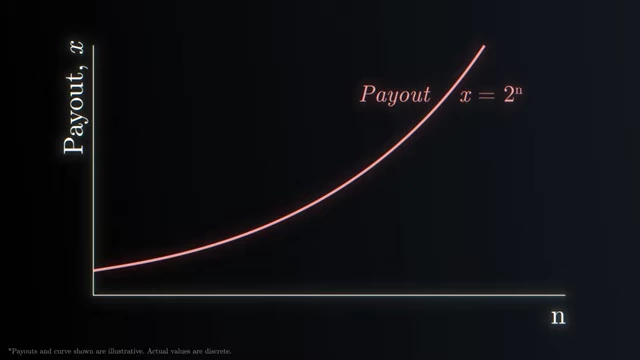
Graph showing payout (x) growing exponentially with the number of tosses (n) in the St. Petersburg Paradox (x = 2^n) [ 00:13:10 ] 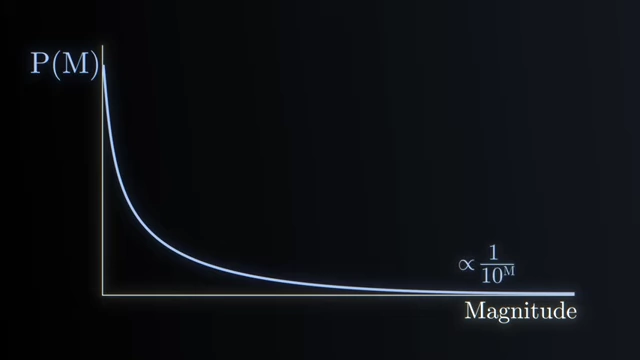
Graph showing the exponential decrease in frequency of earthquakes as their magnitude increases [ 00:14:08 ] - However, the energy released by earthquakes increases exponentially with magnitude, leading to a power law distribution for energy release.
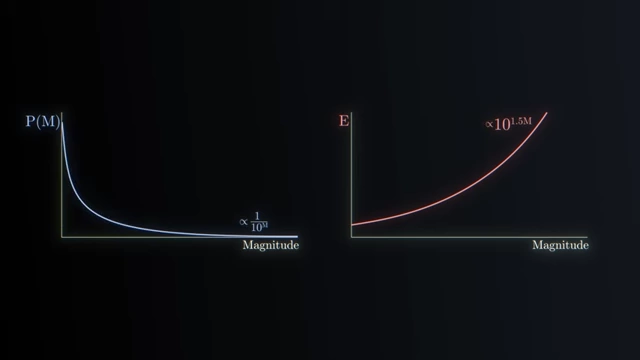
Graphs illustrating the exponential decay of earthquake frequency by magnitude and exponential increase of energy released by magnitude [ 00:14:26 ] 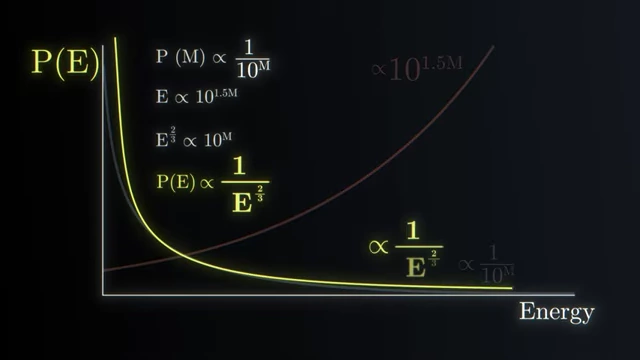
Combination of exponential decay in earthquake frequency and exponential increase in energy to show a power law distribution for energy released [ 00:14:35 ]
Fractals and Power Laws [15:23]
- Self-Similarity and Fractals: The outcomes of the St. Petersburg paradox can be visualized as a fractal tree, exhibiting self-similarity at different scales.
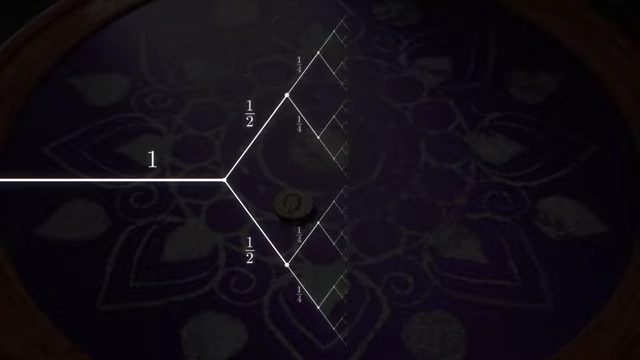
Tree diagram representing outcomes as a self-similar fractal [ 00:14:59 ] 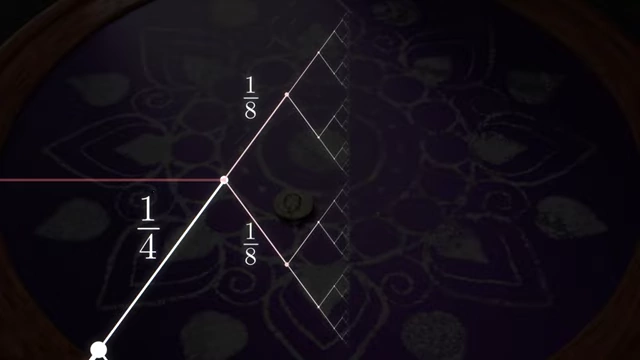
Zoomed-in view of the fractal tree diagram, highlighting self-similarity at smaller scales [ 00:15:08 ] - Power laws are intrinsically linked to fractals because they reveal that a system lacks an inherent physical scale.
- Critical Point in Magnets:
- Magnets consist of atoms with magnetic moments that align at low temperatures to form domains, creating an overall magnetic field.
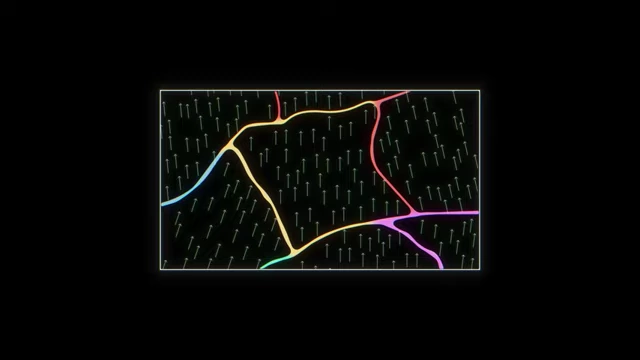
Diagram showing magnetic moments aligning to form domains within a magnet [ 00:16:18 ] - Heating a magnet causes atomic vibrations, disrupting alignment and leading to loss of magnetism above a specific Curie temperature.

Heating a magnetic screw with a torch until it loses its magnetism [ 00:15:48 ] - At this Curie temperature, the magnet is at a critical point, delicately balanced between magnetic and non-magnetic states.
- A simulation of a 2D Ising model (a simplified magnet) at its critical point reveals fractal-like patterns of magnetic domains of all sizes.
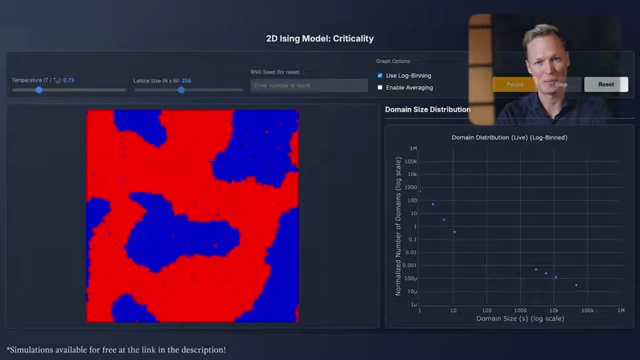
2D Ising model simulation showing magnetic domains and a live log-binned domain size distribution plot [ 00:17:01 ] 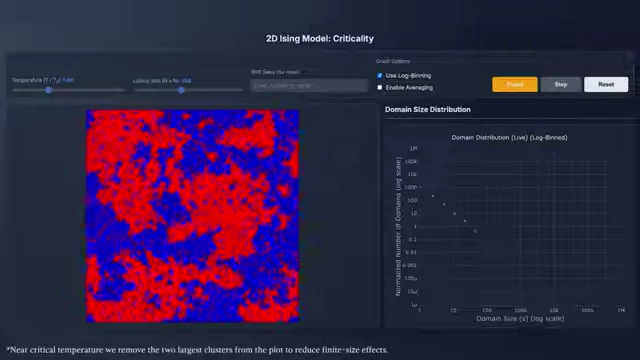
2D Ising model simulation at its critical temperature, displaying fractal-like patterns of magnetic domains [ 00:17:34 ] 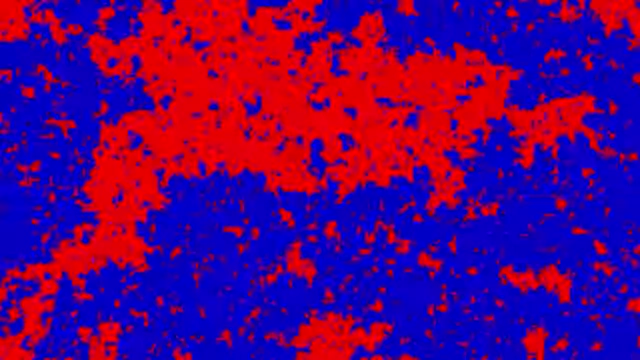
Magnified view of the Ising model simulation, illustrating self-similar magnetic domain patterns at various scales [ 00:18:18 ] - The size distribution of these domains follows a power law.
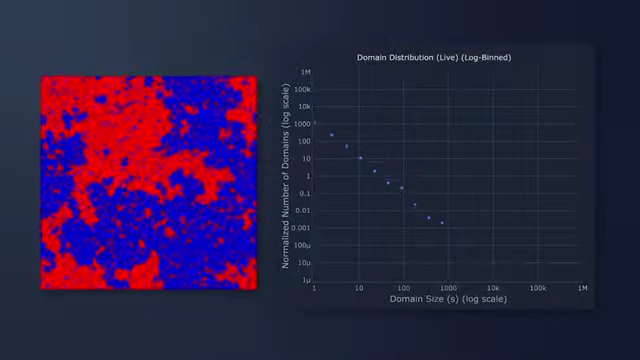
Log-log plot of domain size distribution from the Ising model, confirming a power law relationship [ 00:18:28 ]
- Magnets consist of atoms with magnetic moments that align at low temperatures to form domains, creating an overall magnetic field.
- Scale-Free Systems: The presence of a power law indicates a system with no intrinsic scale, a hallmark of a critical state where small causes can have large, cascading effects.
- At the critical point, the influence of a single atomic spin can cascade through the entire material, making small causes reverberate throughout the system.
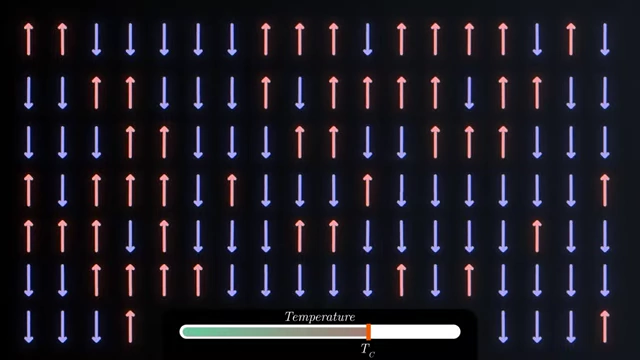
Simulation showing magnetic moments flipping and their influence expanding as a magnet approaches its critical temperature [ 00:19:16 ] 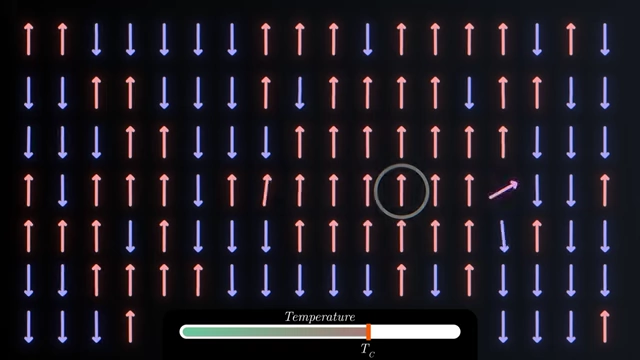
Animation illustrating a single magnetic moment flip cascading through the system at the critical point [ 00:19:49 ]
- At the critical point, the influence of a single atomic spin can cascade through the entire material, making small causes reverberate throughout the system.
Self-Organized Criticality [19:28]
- Concept of SOC: Many natural systems naturally evolve to a critical state without requiring external tuning. This phenomenon is called Self-Organized Criticality (SOC).
- Forest Fires Example:
- Yellowstone National Park in 1988 experienced a massive fire that burned 1.4 million acres, 70 times larger than the previous record.
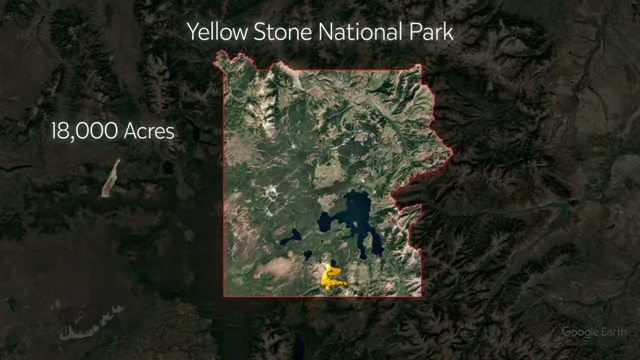
Map comparing the area burned by Yellowstone fires to the size of Manhattan [ 00:20:35 ] 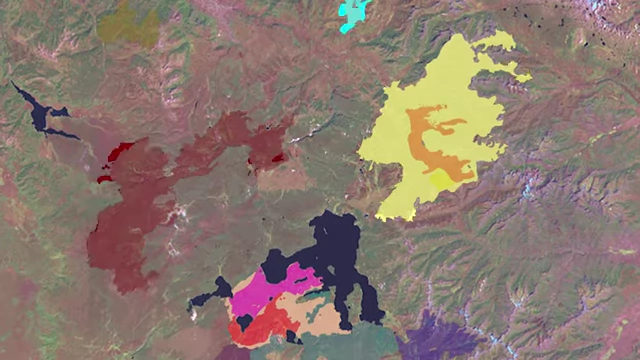
Satellite map showing various megafires merging in Yellowstone National Park [ 00:20:48 ] 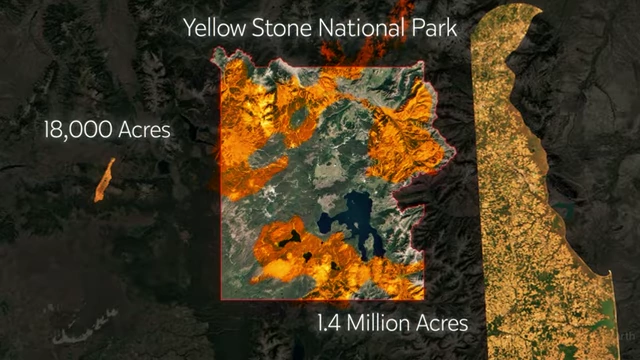
Map comparing the 1988 Yellowstone fires (1.4 million acres) to the size of Delaware [ 00:20:57 ] - A forest fire simulator demonstrates SOC: as trees grow, the forest reaches a critical density.
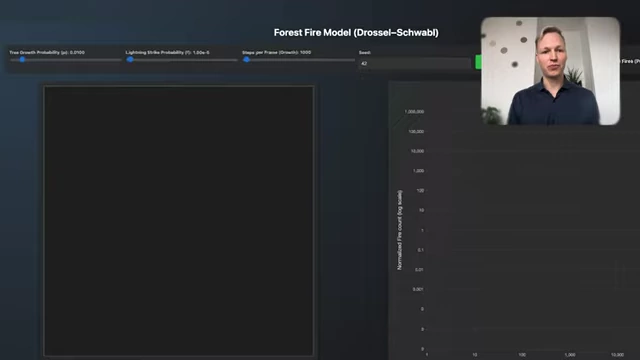
Interface of the Forest Fire Model simulation [ 00:21:22 ] - Lightning strikes (small causes) can trigger fires of all sizes, from tiny blazes to massive megafires that propagate throughout the system.
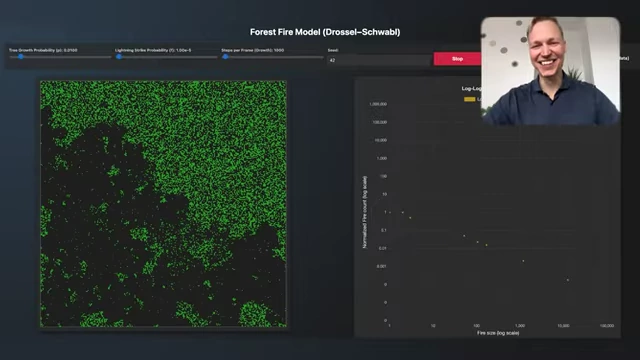
Forest fire simulation showing a massive fire and its power law distribution on the log-log plot [ 00:21:53 ] 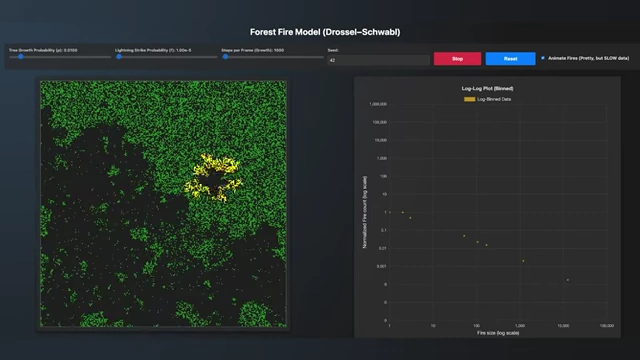
Forest fire simulation illustrating self-organized criticality with trees growing and small fires burning [ 00:22:09 ] 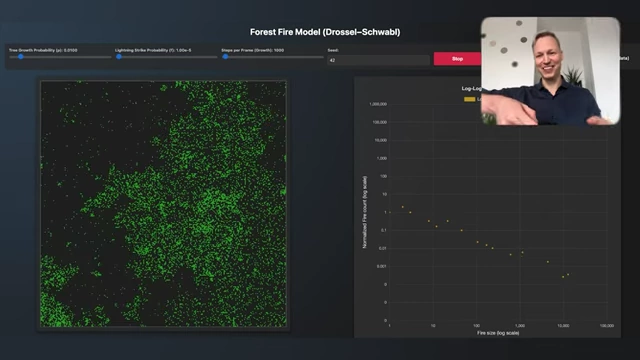
Forest fire simulation after a large fire, showing cleared areas that will regrow, perpetuating the critical state [ 00:22:29 ] 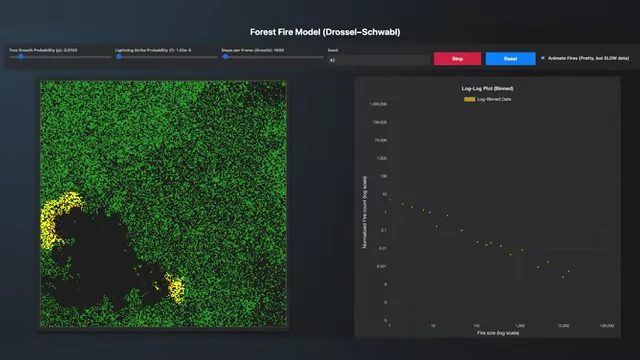
Forest fire simulation showing a dense forest, highlighting conditions ripe for massive fires due to low lightning probability and high tree growth [ 00:22:57 ] - The distribution of fire sizes in such a system follows a power law.
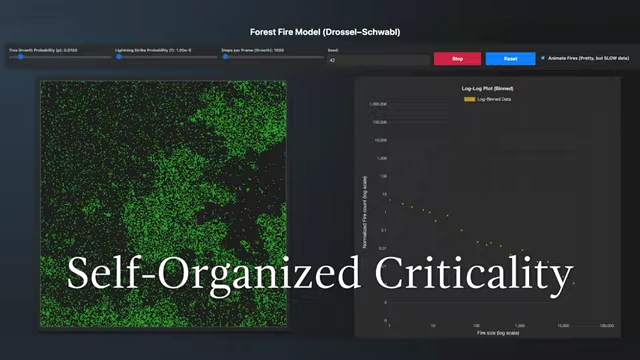
Forest fire simulation demonstrating Self-Organized Criticality, where the system naturally evolves to a critical state [ 00:23:08 ] 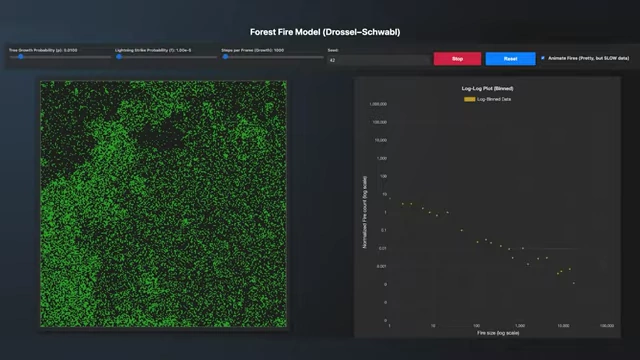
Forest fire simulation showing a dense forest with fire size distribution following a power law [ 00:23:48 ]
- Yellowstone National Park in 1988 experienced a massive fire that burned 1.4 million acres, 70 times larger than the previous record.
Why do we light controlled forest fires? [24:08]
- Fire Management Policies: Historically, the "10:00 AM policy" aimed to suppress all fires quickly.
- Consequences of Suppression: This policy inadvertently led to a buildup of fuel, making megafires even more likely and severe when they eventually occurred, as seen in the simulated scenario with low lightning probability and high tree growth.
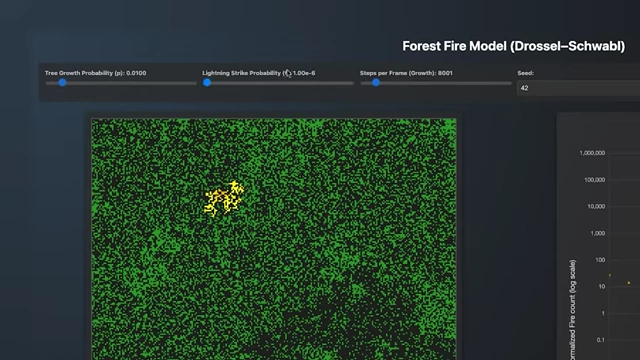
Forest fire simulation with reduced lightning probability and increased tree growth, illustrating how fire suppression leads to dense forests [ 00:25:04 ] 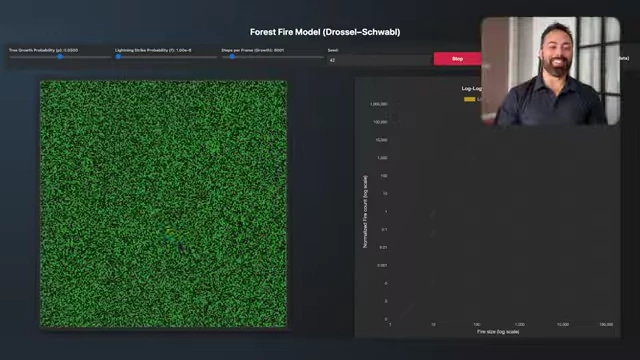
Forest fire simulation showing an inevitable megafire in a dense forest with suppressed small fires [ 00:25:23 ] - Modern Approach: Current fire services recognize the ecological role of small fires.
- They often let small fires burn to clear undergrowth and prevent massive fuel accumulation.
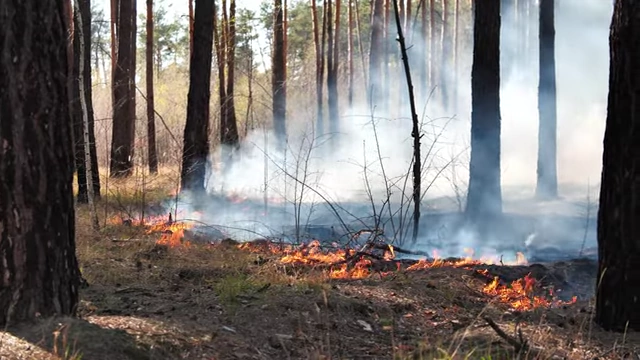
Small controlled fires burning through undergrowth, illustrating modern fire management [ 00:25:32 ] - Intentional controlled burns are also used to reduce fuel and return forests to a more natural, less volatile state.
- They often let small fires burn to clear undergrowth and prevent massive fuel accumulation.
How We Can Predict Earthquakes [26:40]
- Earthquake Mechanics: Earthquakes occur as stresses build up in the Earth's crust and are released along fault lines.
- Kobe Earthquake [1995]: A small stress release on the Nojima fault cascaded into a 40km rupture, causing a devastating earthquake in Kobe, Japan.
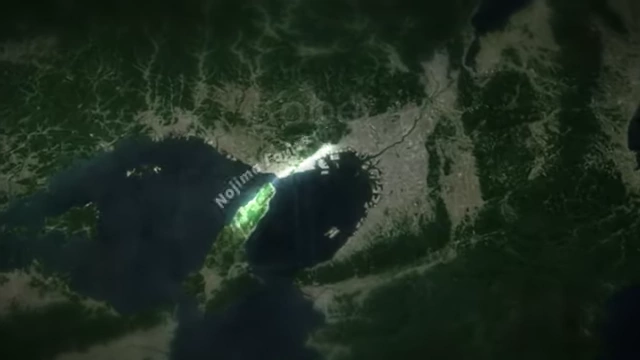
Satellite image highlighting the visible rupture along the Nojima fault line after the Kobe earthquake [ 00:26:46 ] 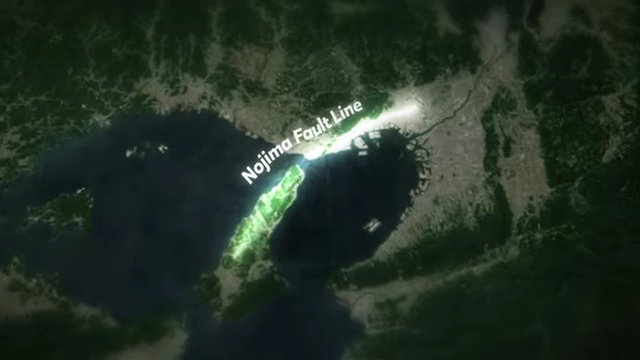
Animation showing stress propagating along the Nojima Fault Line during the Kobe earthquake [ 00:26:52 ] 
Ground rupture and cracks caused by the Kobe earthquake [ 00:27:00 ] - Power Law Behavior: Both small, unfelt tremors and massive, destructive earthquakes are generated by the same physical process, and their energy release follows a power law. This makes them notoriously unpredictable based on past averages.
- Sandpile Model for Earthquakes:
- The Bak-Tang-Wiesenfeld (BTW) sandpile model simulates grains of sand dropped onto a grid. When a stack exceeds a certain height, it "topples," distributing grains to neighbors, creating an avalanche.
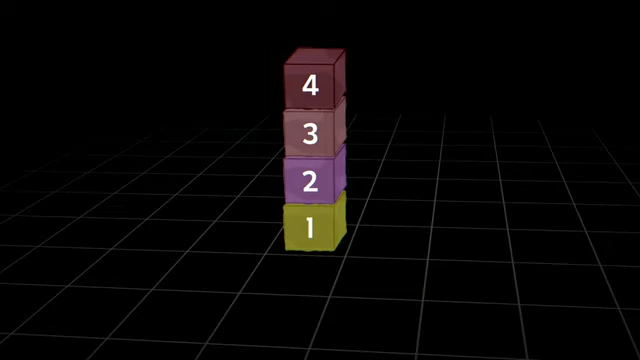
Illustration of a sandpile growing on a grid, showing the accumulation of grains [ 00:28:18 ] 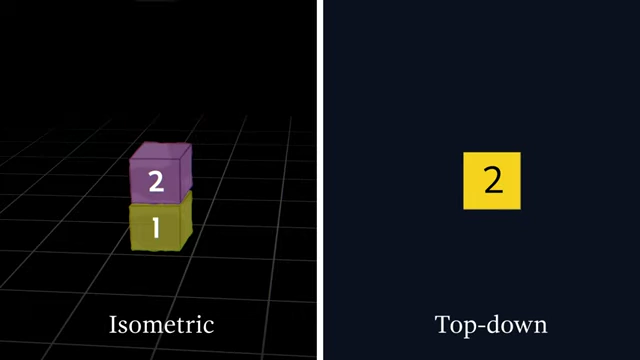
Isometric and top-down views illustrating the rule of four grains leading to a topple in the sandpile model [ 00:28:49 ] - Regardless of how grains are dropped (center or random), the sandpile naturally tunes itself to a critical state.
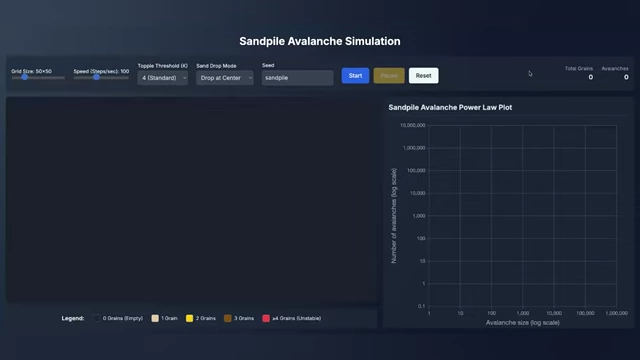
Interface of the Sandpile Avalanche Simulation [ 00:28:37 ] 
Sandpile simulation with grains dropped at the center, forming a symmetrical, fractal-like pattern [ 00:29:04 ] 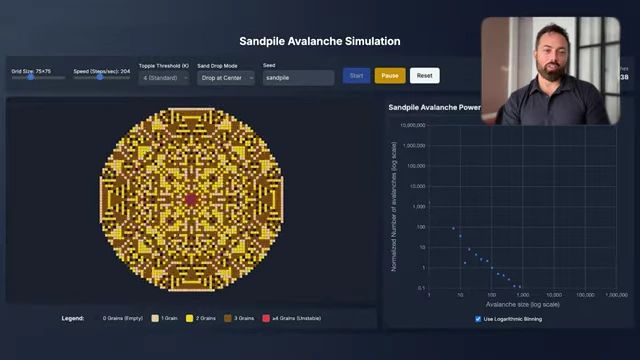
Sandpile simulation showing the fractal pattern of avalanches and their power law distribution on the log-log plot [ 00:29:06 ] - Avalanches of all sizes occur, and their size distribution follows a clean power law.
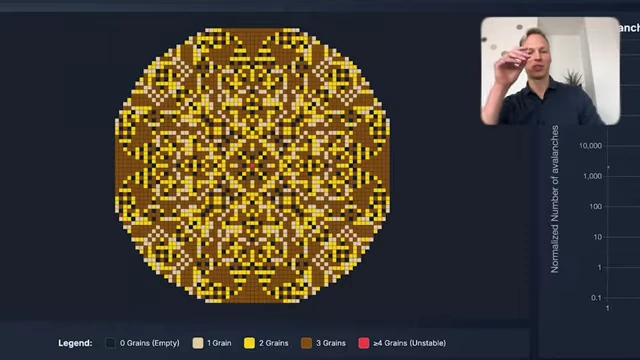
Sandpile simulation showing "fingers of instability" where stacks of grains are poised to topple [ 00:29:33 ] 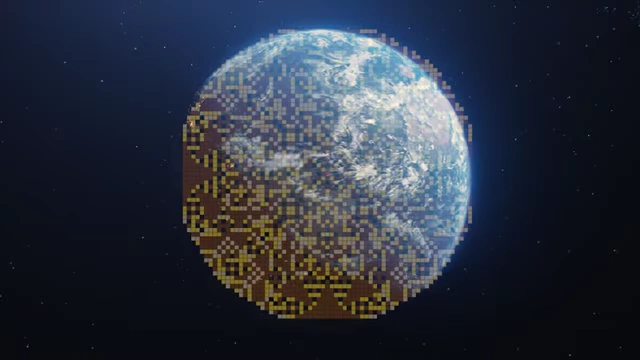
Conceptual image of Earth's crust as a large sandpile, suggesting similar instability [ 00:29:55 ] 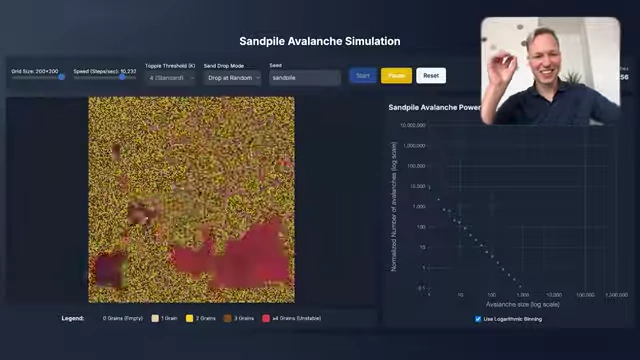
Sandpile simulation with random grain drops, showing the system tuning itself to a critical state and producing avalanches of varying sizes [ 00:30:26 ] 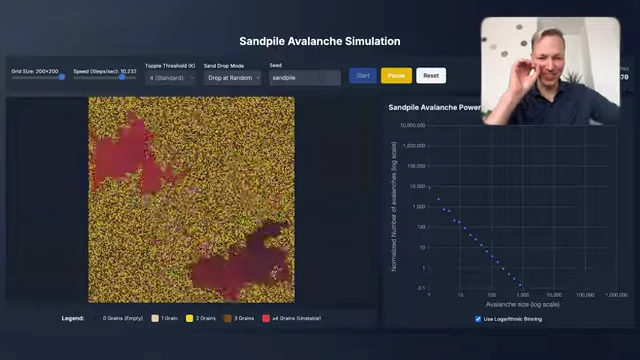
Sandpile simulation with random grain drops and the resulting clean power law distribution of avalanche sizes [ 00:30:32 ] - This power law closely resembles the energy released by real earthquakes, suggesting that the sandpile model captures universal behavior relevant to Earth's crust.
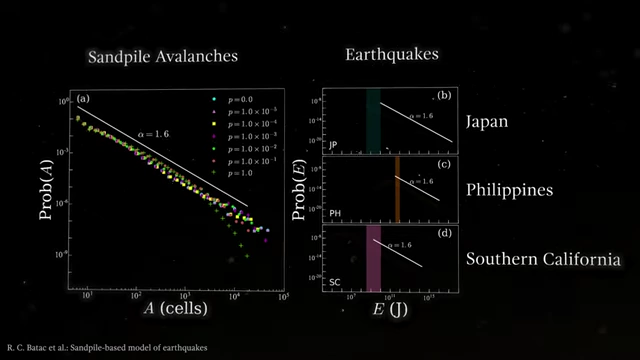
Comparison of power law distributions for sandpile avalanches and real earthquakes in Japan, Philippines, and Southern California [ 00:30:56 ] - The sandpile model can visually resemble the forest fire model, underscoring the universality of these critical behaviors.
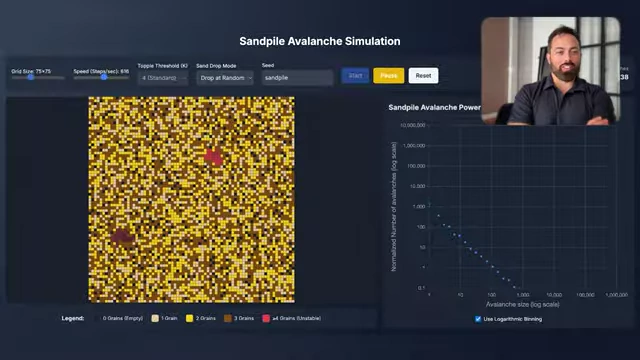
Sandpile simulation, visually resembling the forest fire model, highlighting the concept of universality [ 00:31:13 ]
- The Bak-Tang-Wiesenfeld (BTW) sandpile model simulates grains of sand dropped onto a grid. When a stack exceeds a certain height, it "topples," distributing grains to neighbors, creating an avalanche.
Critical Systems and Universality [32:11]
- Per Bak's Universality: Per Bak, creator of the sandpile model, argued for "universality," where the macroscopic behavior of systems at a critical point becomes independent of their microscopic details.
- This allows simple models to effectively describe highly complex systems (e.g., sandpile -> earthquakes).
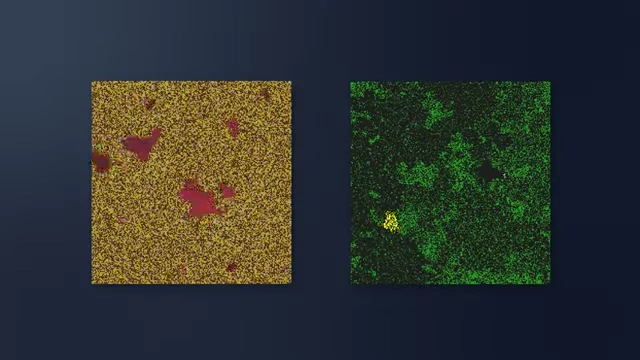
Comparison of the sandpile and forest fire simulations, visually demonstrating similar critical behaviors [ 00:33:26 ] - These systems fall into universality classes, meaning if you understand one system in a class (e.g., the Ising model for magnets), you understand all others in that class (e.g., liquid-vapor critical points).
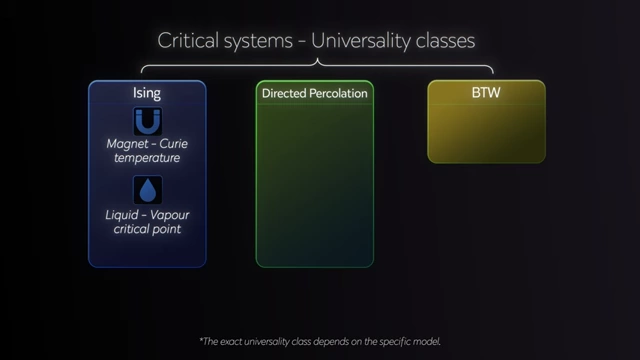
Diagram introducing critical systems and universality classes [ 00:34:31 ] 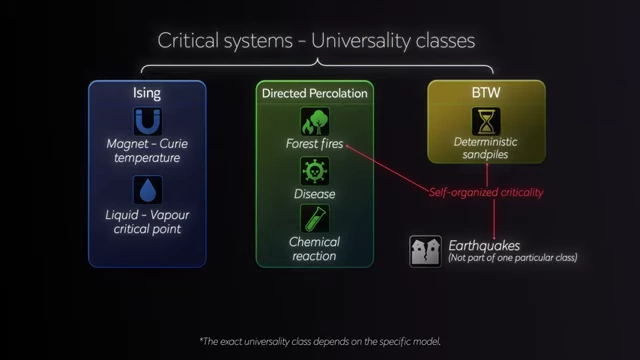
Diagram categorizing critical systems into universality classes, showing connections between magnets, fluids, forest fires, disease, chemical reactions, sandpiles, and earthquakes [ 00:34:35 ]
- This allows simple models to effectively describe highly complex systems (e.g., sandpile -> earthquakes).
- Widespread Power Laws: Power law behavior is observed across many natural and human systems, including:
- City populations, stock price fluctuations, scientific paper citations, and even war deaths.
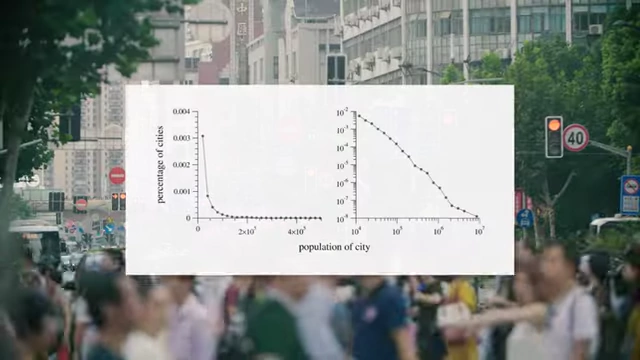
Graph showing city populations following a power law distribution [ 00:35:17 ] 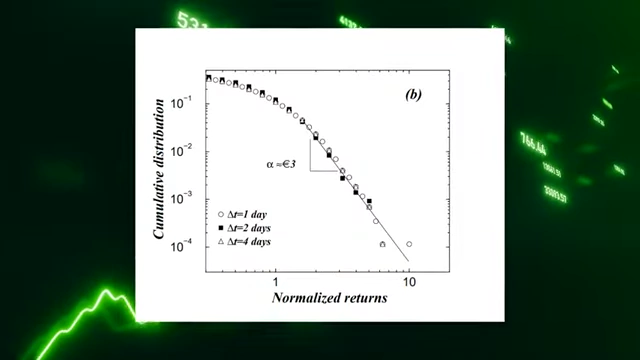
Graph showing normalized returns of stock prices following a power law distribution [ 00:35:19 ] 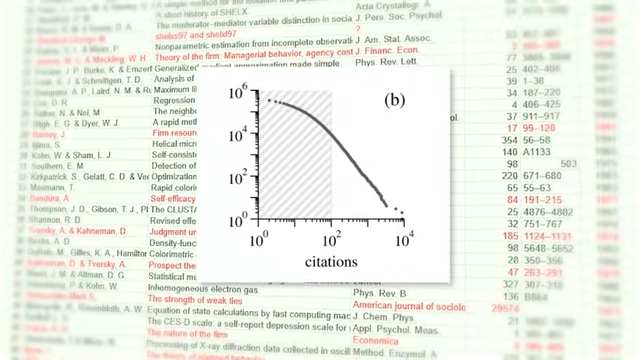
Graph illustrating scientific paper citations following a power law distribution [ 00:35:21 ] 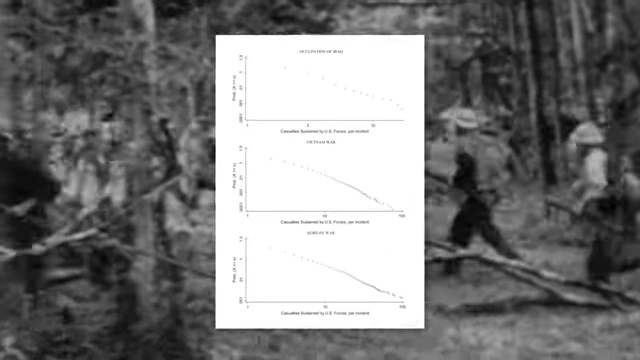
Graphs showing the distribution of casualties in various wars (Iraq, Vietnam, Korea) following a power law [ 00:35:23 ]
- City populations, stock price fluctuations, scientific paper citations, and even war deaths.
- This suggests that many parts of our world might naturally organize themselves into critical states.
How Some Businesses Are Built On Power Laws [36:31]
- Implications for Business Strategy:
- Insurance: Companies must account for power law distributions when insuring against natural disasters like floods and wildfires. Rare, massive events can bankrupt unprepared insurers.
- Venture Capital (VC): VC firms operate on a power law model.
- Many investments lose money or provide modest returns.
- A few "crazy outliers" generate the vast majority of overall profits.
- Example: Horsley Bridge found that 6% of deals generated 60% of returns, while over half lost money. Y Combinator saw 75% of gains from just 2 out of 280 startups.
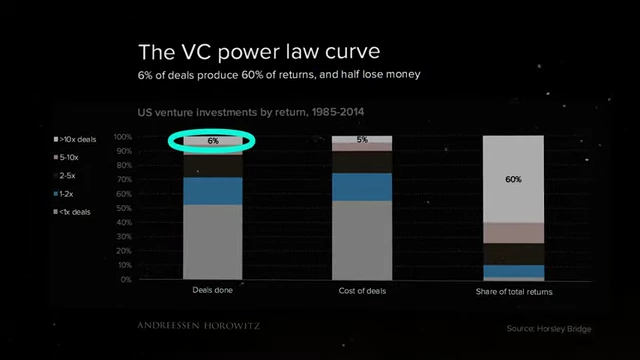
Bar chart illustrating venture capital investment returns, where 6% of deals generate 60% of returns, showing a power law distribution [ 00:37:24 ]
- Publishing/Creative Industries: Similar patterns exist in book publishing (e.g., Harry Potter for Bloomsbury), streaming platforms (top 6% of Netflix shows account for half of viewing hours), and YouTube (less than 4% of videos get 10k+ views but account for 93% of all views).
- These industries thrive on "rare runaway hits."
- Contrast with Normal Distribution Businesses: Industries like restaurants or airlines rely on consistent, average performance to succeed, not extreme outliers.
What game are you playing? Normal or power? [39:30]
- Adapting Behavior: Understanding whether a system follows a normal or power law distribution is crucial for decision-making.
- Normal World (Consistency): If random, additive variations cancel out, leading to a normal distribution, then consistency and aiming for average, reliable results are key.
- Power Law World (Persistence and Risk): If returns can multiply across many orders of magnitude, it makes sense to:
- Take repeated, intelligent risks.
- Most bets will fail, but one wild success can cover all losses.
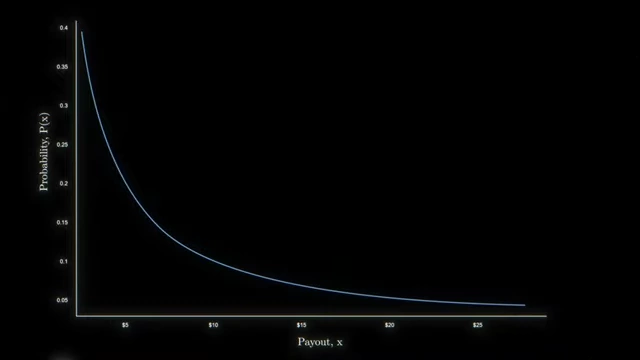
A power law distribution curve, illustrating how outcomes are dominated by rare, extreme events [ 00:39:52 ] - Persistence becomes more important than consistency.
- Preferential Attachment: A common mechanism for power laws in human systems and networks is "preferential attachment," where successful entities (e.g., popular websites, influential people, growing companies) attract more links/attention/resources, accelerating their growth and creating "rich-get-richer" dynamics.
- This leads to a few nodes dominating the distribution, as seen in internet links (e.g., Yahoo vs. most other sites).
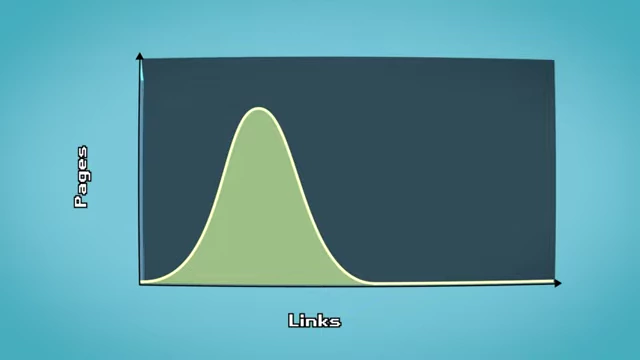
Graph contrasting a normal distribution with the power law distribution of links to webpages on the internet [ 00:40:24 ] 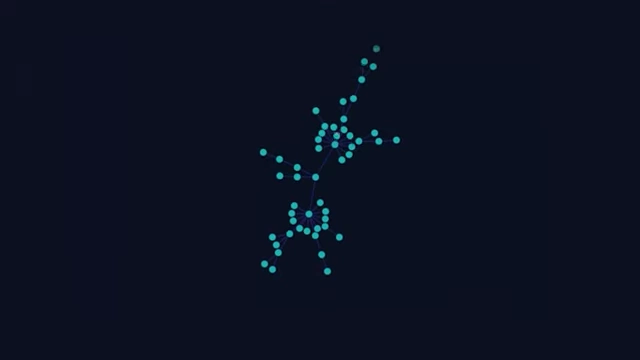
Simulation of network growth via preferential attachment, where new nodes are more likely to connect to existing well-connected nodes [ 00:41:04 ] 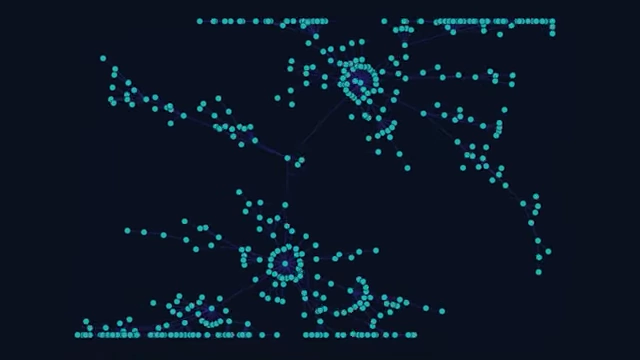
Larger network generated by preferential attachment, illustrating how a few central nodes attract the majority of links, forming a power law [ 00:41:10 ] - Knowing the distribution model (normal, log-normal, or power law) is key to making informed decisions.
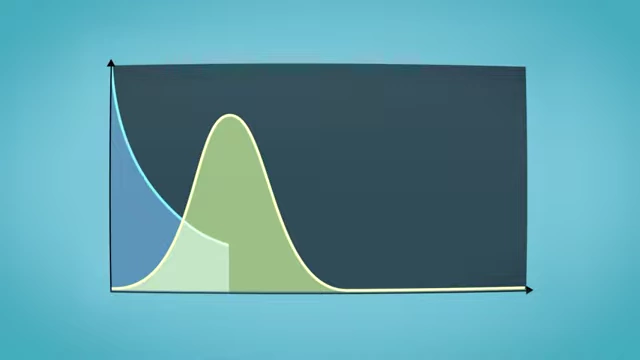
Visual comparison highlighting the difference between a power law (blue, left) and a normal distribution (green, right) [ 00:43:03 ]
- This leads to a few nodes dominating the distribution, as seen in internet links (e.g., Yahoo vs. most other sites).