How Diverging Consumer Sentiment and Stagnant Income Growth Point to an Economic Reset
Summary:
This video explains the unprecedented divergence between consumer confidence in the stock market (high) and consumer sentiment about personal finances (low), signaling a brewing financial issue.
- Stagnant Real Income: Since 2008, real personal income growth has consistently fallen short of historical trends, while the S&P 500 has soared by nearly 300% since 2010.
- Root Causes: This gap is linked to declining personal savings rates and rising corporate profit margins, which disproportionately benefit shareholders who reinvest in assets, inflating their value.
- Housing Affordability: The dynamic has made housing significantly less affordable, impacting the average person's ability to save and invest.
- Wealth Inequality: This leads to the highest wealth inequality in the US since the 1920s, mirroring conditions before the Great Depression.
- Historical Parallel: A "reset" like the one in the 1930s, triggered by rising corporate taxes, might be necessary to rebalance the economy, though it would likely cause a painful asset price correction.

Divergence in Consumer Confidence and Personal Sentiment [ 00:00:45 ]
Unprecedented Divergence in Consumer Sentiment and Stock Market Confidence [00:00:00]

- For the first time in over 30 years, there is a significant divergence between two key economic indicators:
- Consumer confidence in the stock market (blue line) is at one of its highest levels in 30 years, even surpassing the euphoric period of 2000.
- Consumer sentiment regarding personal economic outlook (white line) is at levels similar to the Great Financial Crisis.
- This unusual divergence suggests that something fundamental in the financial system is beginning to break, indicating a deep-rooted problem that requires an economic reset.
Stagnant Real Personal Income Growth Versus Soaring Stock Market Returns [00:00:57]
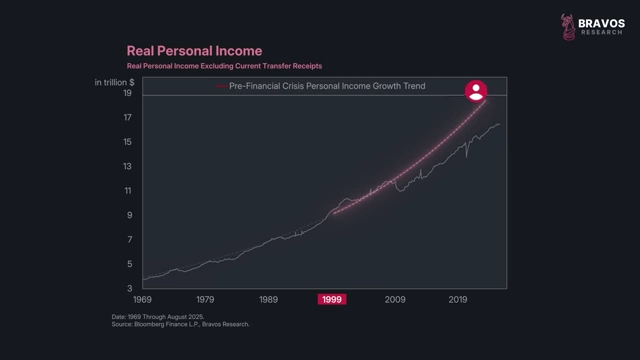
- Historical Income Trend:
- From the 1960s to 2008, real personal income in the US grew at a steady trend of about 2.8% per year, allowing people to form stable financial expectations (permanent income concept by Milton Friedman).
- Post-2008 Stagnation:
- Since 2008, real personal income growth has consistently fallen short of this long-term trajectory.
- The gap between expected and actual income has widened further since the COVID-19 pandemic.
- Stock Market Outperformance:
- In stark contrast, the US stock market has significantly exceeded expectations.
- Since 2010, real personal income has risen by only about 50%, while the inflation-adjusted S&P 500 has soared by nearly 300%.

Comparison of Real Personal Income and Inflation-Adjusted S&P 500 Growth [ 00:02:25 ]
- This persistent disappointment in personal income growth alongside surging stock market returns highlights a growing disparity between the real economy and the financial economy. The video argues this gap cannot continue indefinitely.
The Roots of the Divergence: Personal Savings, Corporate Profits, and Housing [00:03:38]

- Declining Personal Savings Rate:
- The average personal savings rate in the United States has been trending lower since the 1980s, falling from approximately 13% to just 4% today.
- Rising Corporate Profit Margins:
- Simultaneously, corporate profit margins have been steadily climbing, showing a clear divergence from personal savings.
- Wealth Reinvestment Cycle:
- Corporate profits are primarily distributed to shareholders, who, unlike wage earners, tend to reinvest a significant portion of their income back into financial assets.
- This reinvestment fuels asset price appreciation across various markets, including stocks, gold, Bitcoin, private equity, and real estate, which are currently at or near record highs.
- This process, while a natural part of the financial system, becomes problematic when it affects essential assets like housing.
- Housing Affordability Crisis:
- Historically (over the last 60 years), the average home price was roughly four times the yearly household income in the US.
- Since the late 1990s, this ratio has climbed to approximately seven, making housing about two times less affordable.
- As shelter is the largest component of the Consumer Price Index, rising housing costs consume a disproportionately large share of people's incomes.
- This leaves less room for saving and virtually no capital left to invest in the very assets (stocks, gold, Bitcoin) that are compounding wealth for those who can afford them, thus creating a cycle where many households are unable to build wealth.
Consequences: Declining Standard of Living and Extreme Wealth Inequality [00:05:36]

- Deteriorating Outlook on Standard of Living:
- The percentage of Americans who believed they had a good chance of improving their standard of living has drastically fallen:
- 75% in 2000
- 50% in 2010
- 25% in 2025
- This represents a significant decline in optimism over a 25-year period.
- The percentage of Americans who believed they had a good chance of improving their standard of living has drastically fallen:
- Highest Wealth Inequality Since the 1920s:
- These trends have contributed to the highest level of wealth inequality in the US since the 1920s, with the share of wealth owned by the top 0.1% of the US population surging.
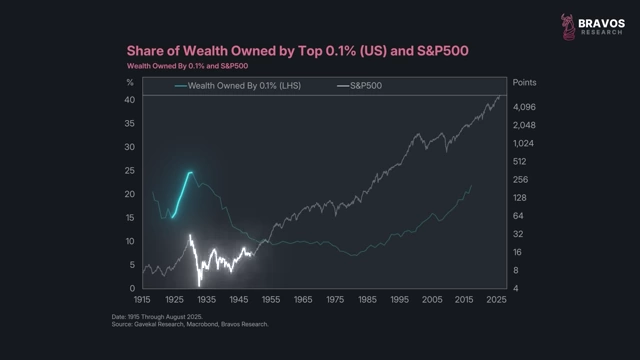
Share of Wealth Owned by Top 0.1% (US) and S&P 500 Index [ 00:06:50 ] - This level of inequality is what many people refer to when discussing the need for an "economic reset" to return to more equitable distribution, similar to the period of prosperity and a thriving middle class seen in the mid-20th century.
- These trends have contributed to the highest level of wealth inequality in the US since the 1920s, with the share of wealth owned by the top 0.1% of the US population surging.
The Economic Reset and the Role of Corporate Taxes [00:06:07]
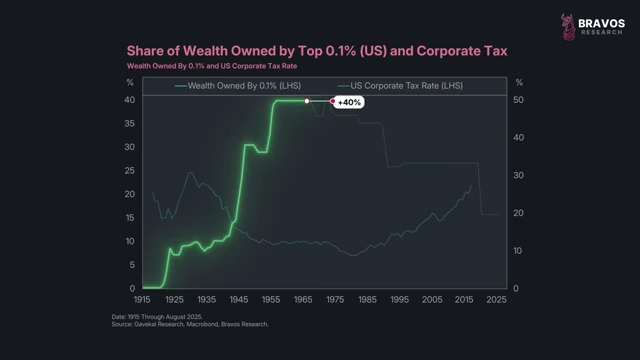
- Historical Parallel with 1929:
- The peak in wealth inequality in 1929 perfectly coincided with the top of the stock market, reflecting how rising asset prices (stocks, housing) contribute to inequality.
- The market crash between 1929 and 1940 initiated a reversal in wealth inequality.
- The Catalyst for Reset: Corporate Tax Increases:
- This reversal was driven by a significant increase in the top marginal US corporate income tax rate, which rose from 0% in the 1910s to nearly 40% over several decades.
- While economically painful, squeezing corporate profits, lowering asset prices, and increasing unemployment, these tax increases helped flip the wealth inequality trend.
- High corporate taxes coincided with a prolonged period of low wealth inequality and a strong middle class.
- The 1980s Shift:
- In the 1980s, corporate tax rates were significantly reduced to alleviate pressure on struggling businesses and stimulate the economy.
- This policy led to accelerated economic growth and substantial asset price appreciation (e.g., S&P 500 saw nearly 20% annual returns from 1982-1999).
- However, these tax cuts also set the stage for wealth inequalities to steadily rise again over subsequent decades.
- Current State:
- Today, corporate tax rates are at their lowest levels since the 1930s, and, concurrently, wealth inequality has risen to its highest levels since the 1930s.
Future Outlook: The Impending Reset Trigger [00:09:00]

- Prediction of the Next Reset: The video predicts that the next "great economic reset" will occur when corporate tax rates eventually reverse their long-term downward trend and begin to move higher.
- Consequences of Rising Corporate Taxes:
- This policy shift is expected to cause significant economic pain, leading to a violent drop in asset prices, similar to what occurred in the 1930s.
- Stock Market's Anticipation:
- Given that the stock market discounts future events, it is plausible that the market could peak before corporate taxes actually begin to rise, as was observed in 1929 (the market peaked a year or two before tax hikes in 1931).
- The current strategy favors long positions in assets like stocks, gold, and crypto due to ongoing inflows. However, the strategy will shift to a defensive posture once this trend flips.