Prometheus 3.0: Major Updates to Observability, OpenTelemetry, and Remote Write
Summary:
- Prometheus 3.0 introduces a completely rewritten UI with a metrics and labels explorer, query tree view, and an "explain" tab for debugging, enhancing user experience and query building.
- Native histograms offer significant improvements over classic histograms by using exponential bucket boundaries and storing data as a single complex sample, leading to better efficiency, accuracy, and easier aggregation.
- Remote Write 2.0 enhances efficiency and network bandwidth by intern-ing label data and supporting new Prometheus features like native histograms and created timestamps.
- Prometheus 3.0 adds native OpenTelemetry (OTel) support, allowing direct ingestion of OTLP metrics and promoting resource attributes to labels for easier querying.
- The new version also includes full UTF-8 support for metric names, label names, and values, enabling a broader range of characters and symbols like emojis.
- Prometheus is working on Governance 2.0 to simplify community involvement and leadership attraction, including a clear ladder for contributors, members, maintainers, and a steering committee.
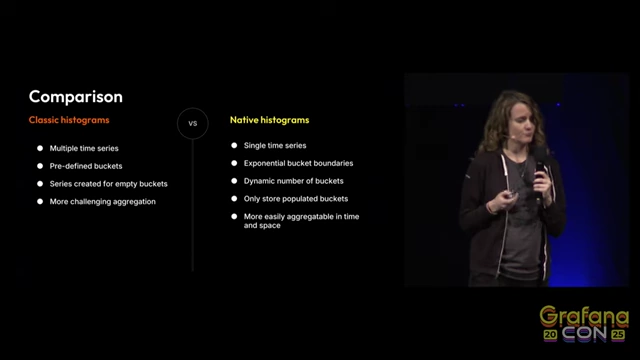
Comparison of Classic vs. Native Histograms [ 00:07:38 ]
Introduction & History of Prometheus [00:00]
- The presentation introduces Prometheus 3.0, the first major release in seven years, following Prometheus 2.0 in 2017.
- Prometheus originated at SoundCloud 12 years ago and became the second project to graduate from the CNCF.

Prometheus Project Timeline [ 00:00:50 ]
What's New in Prometheus 3.0 [01:38]
- Prometheus 3.0 includes significant updates:
- New UI and query tools.
- Native histograms.
- OpenTelemetry (OTel) compatibility.
- UTF-8 support.
- Remote Write 2.0.
- Several minor version bumps and future enhancements.
New UI & Query Tools [02:37]
- The UI has been completely rewritten by Julius Voltz using React and Mantine framework.
- Goal: Less cluttered, more consistent, and easier to navigate layout.
- Improved development and maintenance.
- Metrics and Labels Explorer:
- Helps build queries by allowing users to view and search metrics and their metadata.
- Users can select a metric and drill down into label names and values to add filtering.
- Similar functionality to Grafana UI.
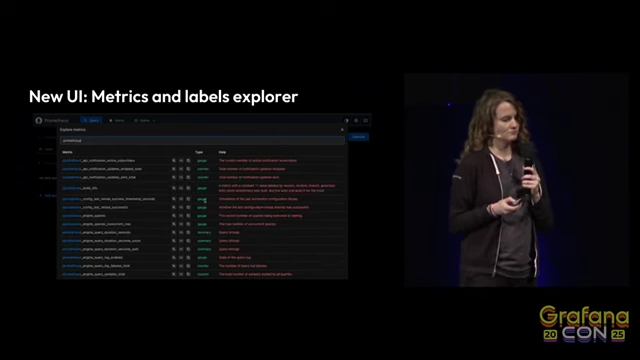
New Prometheus UI: Metrics and Labels Explorer [ 00:03:09 ]
- Query Tree View:
- Adapted from PromLens, this feature breaks down PromQL queries into sub-expressions.
- Provides inline documentation and metadata for each part of the query.
- Users can click on nodes to see evaluation results and existing label data.
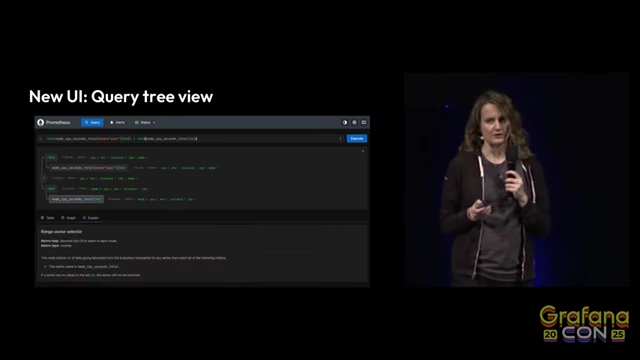
New Prometheus UI: Query Tree View [ 00:03:59 ]
- Explain Tab for Debugging:
- Offers more context on query nodes with explanations, insights, and visualizations.
- Visualizes how series are joined in binary operations by describing match groups.
- Makes debugging easier by identifying issues in query parts with explanations and visualizations.
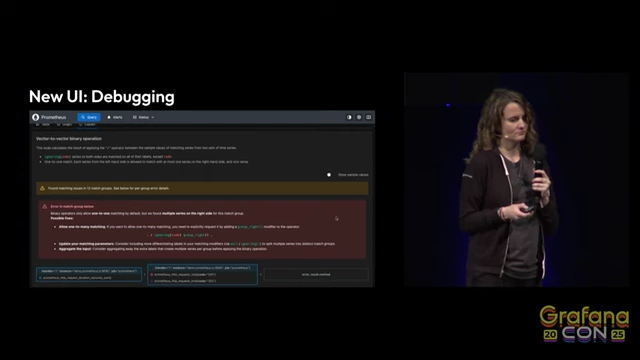
New Prometheus UI: Explain Tab for Query Debugging [ 00:04:49 ]
- Future UI Enhancements:
- Continuous work on graph panel fixes, including vertical lines and clipboard functionality.
- In-progress work on UTF-8 quoting, auto-completion, and rendering native histograms and heatmaps.
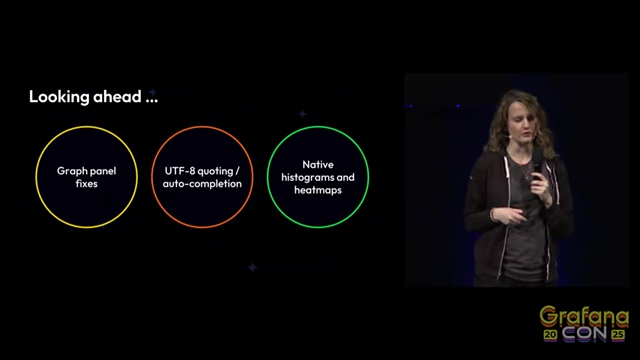
Upcoming UI Features [ 00:04:59 ]
Native Histograms [05:17]
- General Concept: Histograms store data point distributions as counts within ranges, primarily for quantile estimation.
- Classic Histograms Drawbacks:
- Require predefined bucket boundaries, which are hard to determine and require re-instrumentation upon changes.
- Expensive to store as each bucket creates a new time series, consuming significant space.
- Coarse buckets, due to cost, lead to inaccurate quantile estimation.
- Aggregation is only possible if bucket boundaries match exactly.
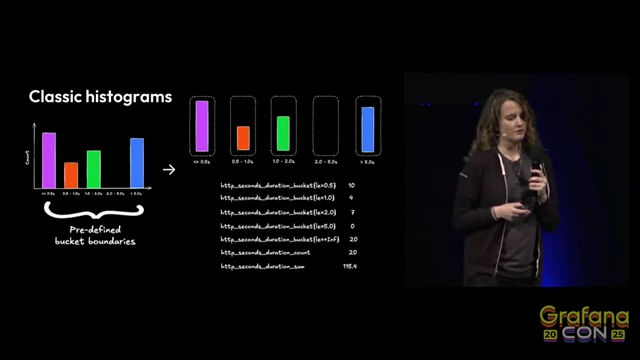
Classic Histograms with Predefined Bucket Boundaries [ 00:05:58 ]
- Native Histograms Benefits:
- Bucket boundaries are calculated based on an exponential scale, enabling easier aggregation and merging.
- Stored as a single complex sample, encompassing all necessary data, rather than multiple time series.
- Significant improvements in efficiency for cost and space.
Comparison of Classic vs. Native Histograms [ 00:07:38 ]
- Querying Native Histograms:
- Example: Graph showing bucket counts and boundaries of a native histogram.
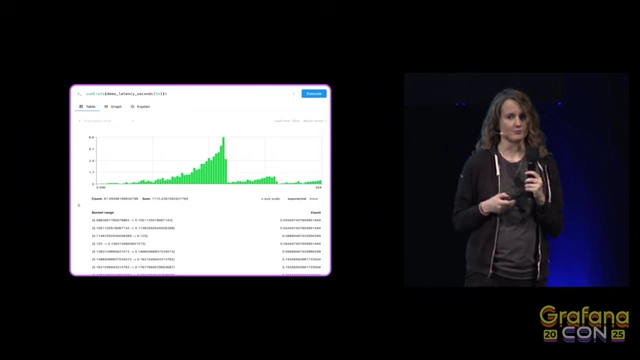
Native Histogram Querying Example: Bucket Counts [ 00:07:48 ] - Example: Quantile estimation for the 50th percentile of a native histogram sample.
- Querying differs slightly; for instance, the "LE" label is not needed.
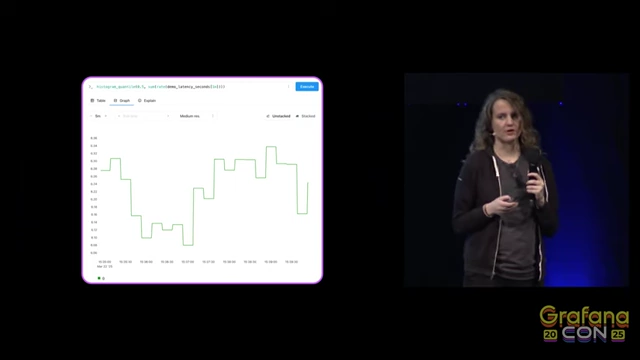
Native Histogram Querying Example: Quantile Estimation [ 00:08:03 ]
- Example: Graph showing bucket counts and boundaries of a native histogram.
- Future of Native Histograms:
- Focus on stability, including text format, operators, and function refinements.
- Development of heatmaps in the UI.
- Native Histograms with Custom Buckets:
- Addresses scenarios where exponential scale doesn't fit data or legacy code prevents re-instrumentation.
- Allows storing data in a single time series while using predefined bucket boundaries.
- Enables conversion of classic histograms to native histograms with custom buckets at scrape time without data loss.
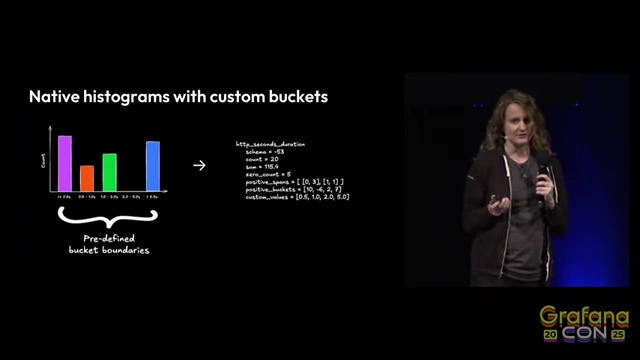
Native Histograms with Custom Buckets [ 00:09:27 ]
Remote Write 2.0 [09:39]
- Purpose: A protocol for Prometheus-compatible senders to forward scraped metric data in real-time to receivers.
- Remote Write 1.0:
- Sent data using snappy-encoded protobuf messages over HTTP.
- Used back-off retry semantics based on receiver response codes.

Remote Write 1.0 Architecture [ 00:10:17 ]
- Remote Write 2.0 Improvements:
- Enhances efficiency and network bandwidth.
- Supports newer Prometheus features like native histograms and created timestamps.
- Reduces request size dramatically by string-interning all label data.
- Supports partial write failures, allowing receivers to respond with error statistics and senders to retry.
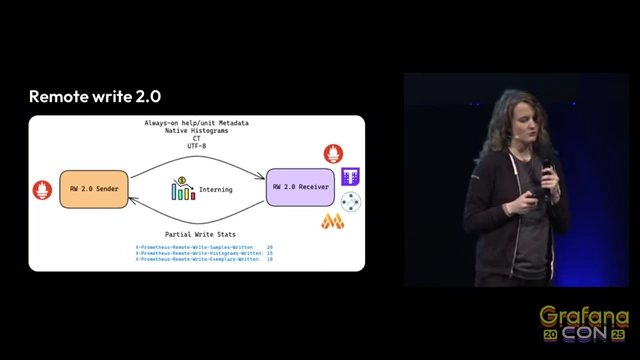
Remote Write 2.0 Architecture [ 00:11:06 ]
- Efficiency Gains: Showcases massive improvements in bandwidth and serialization levels compared to Remote Write 1.0.

Remote Write 2.0 Performance Improvements [ 00:11:23 ] - Ease of Adoption: An experimental library in client-golang facilitates the creation of Remote Write 2.0 compatible senders and receivers.
- Future of Remote Write:
- Goal: Mark as non-experimental.
- Continuous work on sending created timestamps and improving metadata efficiency.
- Experimentation with various compression formats and formats like Apache Arrow.
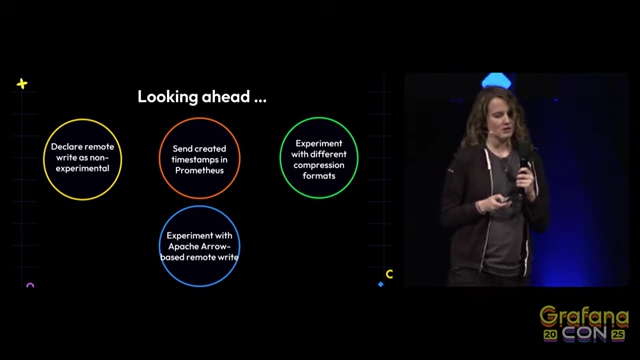
Future Plans for Remote Write [ 00:11:56 ]
OpenTelemetry (OTel) Support [12:25]
- A major push to support OTel natively in Prometheus.
- OTLP Endpoint:
- Prometheus now accepts OTLP metrics pushed to
/api/v1/otlp/v1/metricsusing a POST request. - This feature must be explicitly enabled with a
web.enable-otlp-receiverfeature flag. - The spec for converting OTLP data to Prometheus is still evolving.
- Prometheus now accepts OTLP metrics pushed to
- Promote Resource Attributes:
- A configuration option to copy OTel resource attributes (e.g., namespace, cluster name) directly into Prometheus labels.
- This simplifies querying by avoiding complex joins.
- Future work aims for automatic promotion without manual configuration.
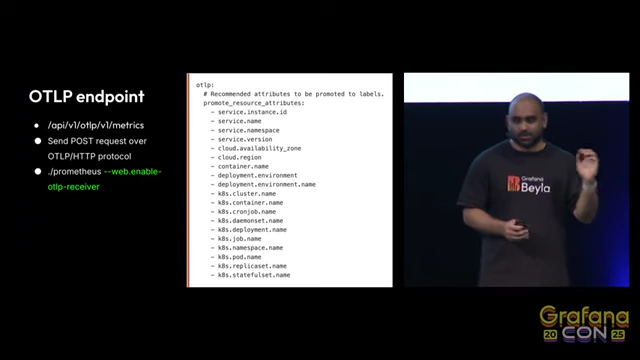
OTLP Endpoint with Promote Resource Attributes Configuration [ 00:13:55 ]
UTF-8 + Emoji Metrics [14:50]
- Expanded Character Support:
- Prometheus now supports UTF-8 metric names, label names, and label values.
- This enables the use of characters like dots and slashes, which are common in OTel semantic conventions.
- Even emojis can be used in labels and metric names.
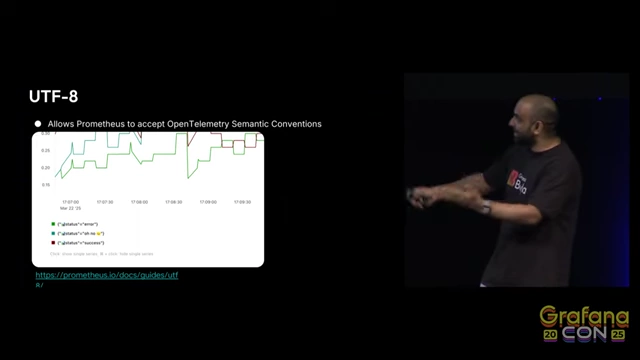
UTF-8 Support in Prometheus Metrics with Emojis [ 00:14:49 ]
- Future of OTel and UTF-8:
- Expand UTF-8 support across all client libraries (e.g., Ruby).
- Utilize type and unit metadata from OTel to provide insights (e.g., warn about rate over gauge).
- Support OTel Semantic Conventions to auto-generate insights for common metrics (e.g., HTTP metrics).
Delta Temporality [15:57]
- Current State: Prometheus primarily supports cumulative temporality (total number of requests seen so far).
- Future Support:
- Aim to natively support delta temporality, where only changes (deltas) are pushed, similar to StatsD or Datadog.
- This feature is currently experimental and needs a more robust native implementation.
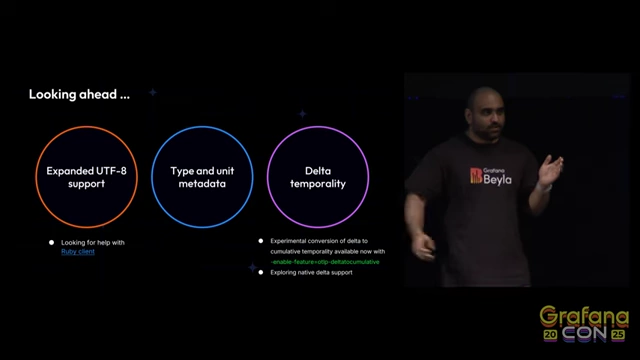
Future Plans for OpenTelemetry Support, including Delta Temporality [ 00:16:06 ]
- Integration Example: A native histogram with UTF-8 characters ingested via the OTLP endpoint and queried on the new UI.
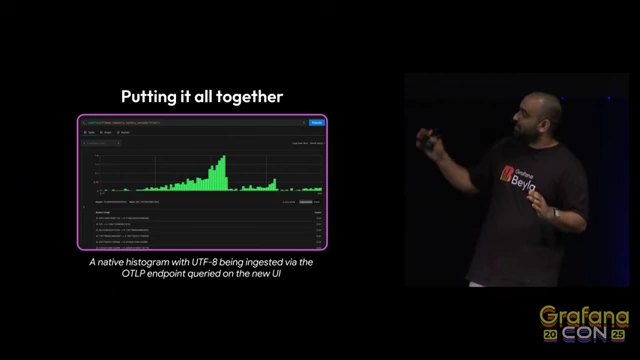
Native Histogram with UTF-8 and OTLP on New UI [ 00:16:44 ]
Breaking Changes [17:02]
- Prometheus 3.0 aimed for seamless upgrades with minimal breaking changes, affecting a very small number of users.
- Examples of Breaking Changes:
- Removal of the
holt_wintersfunction. - Changes in left-open range and subquery selectors (e.g.,
[t1, t2)to[t1, t2]), which could break specific rate queries. - Removal of implicit fallback to Prometheus Text format (0.0.4) for scraping, which affected some older client libraries like Sinatra (Ruby client) that used commas instead of semicolons in protocol responses.
- Removal of the
Prometheus Activity & Governance 2.0 [19:48]
- Prometheus Activity: The project remains very active, with consistent commits across versions, indicating ongoing development.

Prometheus Commit Activity Over Time [ 00:20:03 ] - Governance 2.0 Initiative:
- Objective: Address the challenge of attracting new leadership and simplify community involvement.
- The previous governance model, requiring a two-thirds majority for changes, became a bottleneck as the project grew.
- New Structure (Ladder):
- Contributors: Anyone who has contributed (e.g., thumbs up on a release page).
- Members: Individuals with 10 contributions over 36 months, added to the GitHub org for more project influence.
- Maintainers: Individuals with commit and push rights, maintaining exporters, client libraries, and parts of Prometheus/Alertmanager.
- Steering Committee: 5-7 members elected by members, with the authority to change governance and prevent deadlocks.
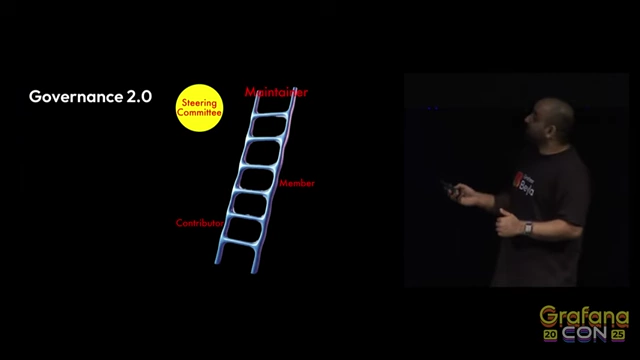
Prometheus Governance 2.0 Structure [ 00:22:32 ]
- Current Status: 22 new team members (long-term contributors) have been added to help vote for the new governance. The voting mechanism for the steering committee is still being determined.
- Get Involved: Community involvement is encouraged, regardless of the new governance finalization. Many open issues and opportunities exist for contributions in various Prometheus sub-projects.