Setting Up and Utilizing Model Context Protocol (MCP) Servers for Observability with Prometheus, Grafana, Tempo, and Loki via GitHub CoPilot
This video demonstrates how to configure and use Model Context Protocol (MCP) servers to enable observability for the LGTM stack (Loki, Grafana, Tempo, Prometheus) on a remote EC2 instance using GitHub CoPilot. The speaker initiates by setting up an AWS EC2 instance with Grafana, Prometheus, and Loki, verifying their operational status and data sources. He then details the configuration of local MCP servers for Grafana, Loki, and Prometheus, emphasizing the need for API keys and cloning specific GitHub repositories. The core demonstration involves using GitHub CoPilot as an agentic AI to interact with these MCP servers. CoPilot is successfully used to create and update Grafana dashboards for node exporter metrics, logs, top 10 Prometheus metrics, and EC2 memory observability. The video also shows CoPilot querying Grafana to list users and data sources, highlighting its capability to simplify complex observability tasks through natural language commands without manual query writing. The process streamlines the management and visualization of monitoring data, showcasing the power of AI in DevOps.
Introduction to Model Context Protocol (MCP) Servers [0:00]
The video introduces an extended session on Model Context Protocol (MCP) servers, focusing on enabling communication from a local laptop to a Grafana instance and the entire LGTM (Loki, Grafana, Tempo, Prometheus) stack installed elsewhere, specifically on an EC2 instance. The main goal is to demonstrate how GitHub CoPilot can act as an agentic AI to pass commands to these observability tools via MCP servers.
- MCP Purpose: Facilitate communication between a local machine and remote observability tools like Grafana, Loki, Tempo, and Prometheus.
- Agentic AI with GitHub CoPilot: Utilize CoPilot to send natural language commands to the MCP servers, automating tasks like dashboard creation and data querying without needing to write complex queries or manual configurations.
- Configuration: The setup involves using an
mcp.jsonfile within VS Code, which defines the configurations for different MCP servers.
Environment Setup and Verification [1:27]
The first step involves preparing the remote environment where the observability tools are hosted.
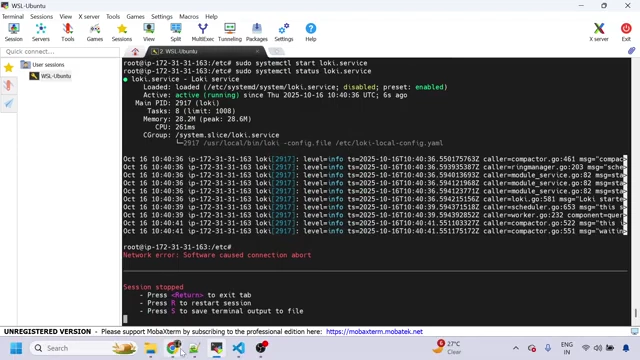
- AWS EC2 Instance: A working EC2 instance is used to host Grafana, Prometheus, and Loki.
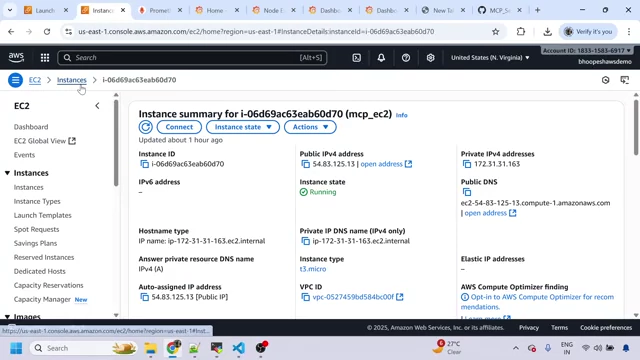
AWS EC2 instance summary showing a running instance. [ 00:01:40 ] - Verification of Services: The speaker verifies that Grafana, Prometheus, and Loki services are running on the EC2 instance.
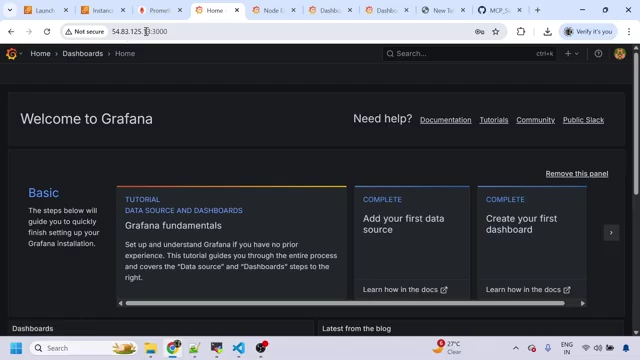
- Grafana is running on port 3000.
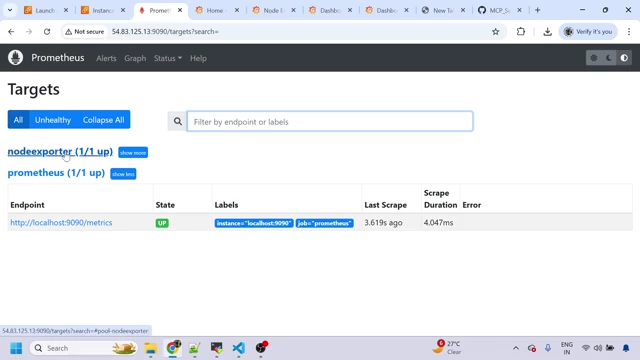
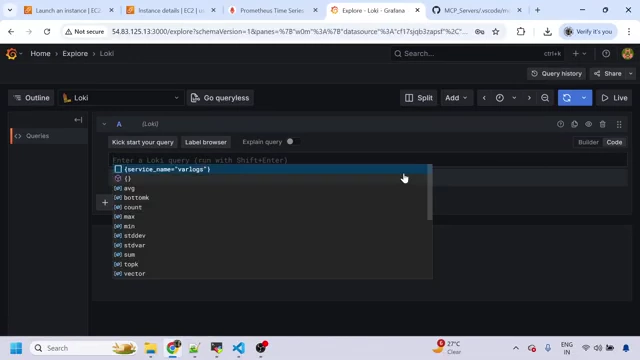
- Verification of Services: The speaker verifies that Grafana, Prometheus, and Loki services are running on the EC2 instance.
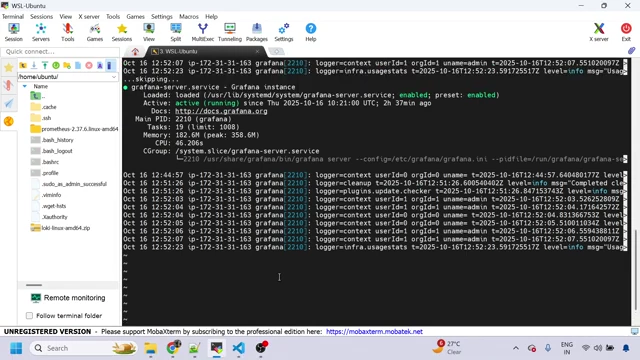
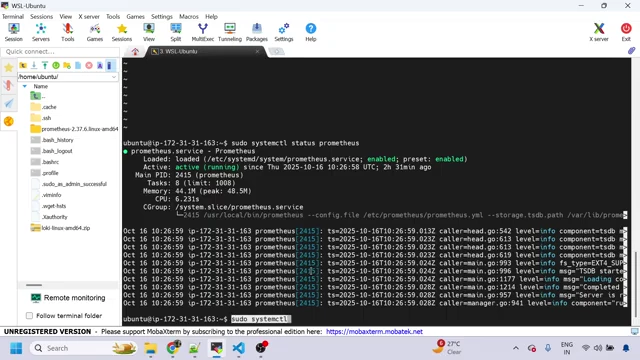
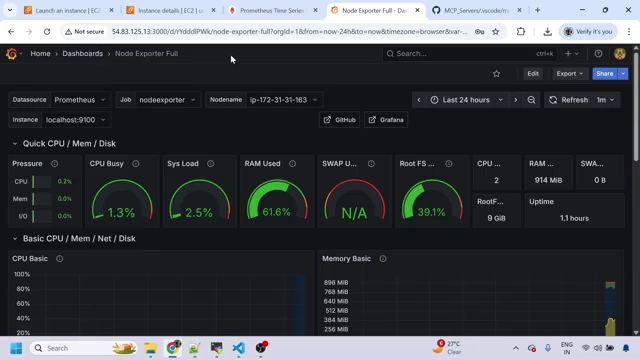
Configuring Local MCP Servers [4:44]
To enable communication between GitHub CoPilot on the local machine and the remote observability stack, individual MCP servers for each tool need to be set up locally.
- Grafana MCP Server [4:44]:
- Download: The binary version of the Grafana MCP server is downloaded from its GitHub repository.
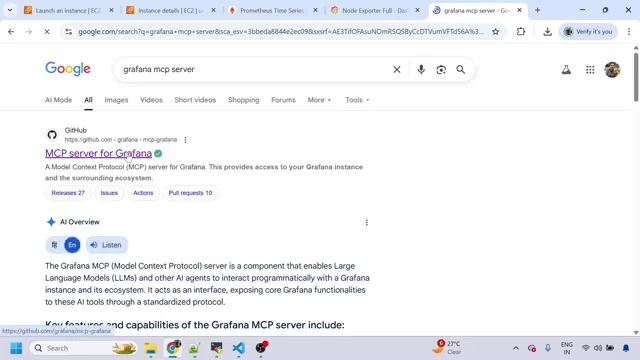
Google search results for Grafana MCP server GitHub repository. [ 00:05:06 ] - Environment Variable: The downloaded binary is added to the local machine's environment variables.
- Command Configuration: The
mcp.jsonfile contains the command to run the Grafana MCP server, including the EC2 instance's public IP address (on port 3000) and a Grafana API key. - API Key Generation: An API key (service account token) is generated within Grafana's administration section (Administration > Users and access > Service accounts > Tokens) to authenticate the MCP server with the Grafana instance.
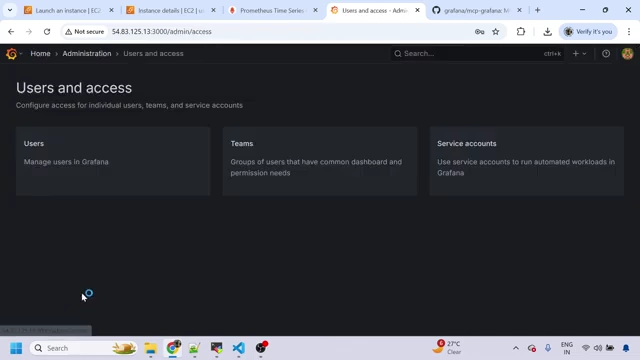
Grafana Administration: Users and Access page. [ 00:05:55 ] 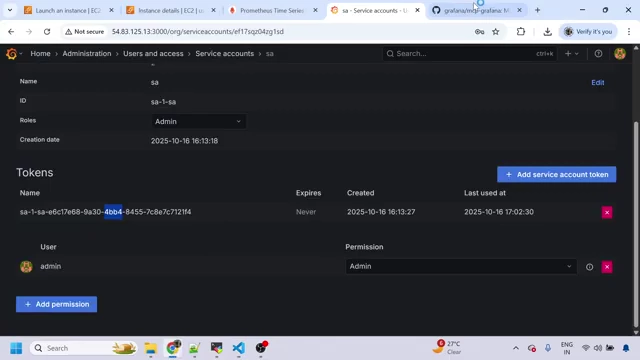
Grafana Service Accounts page with an existing service account token. [ 00:06:17 ] 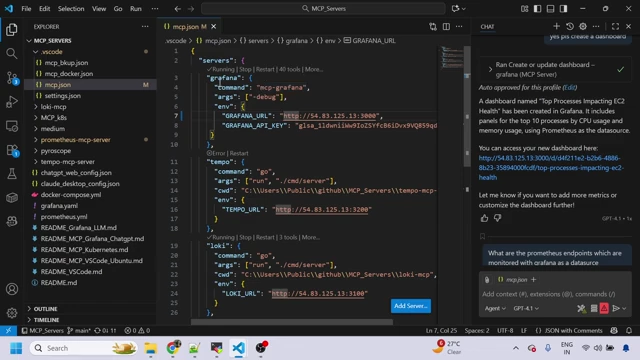
Grafana MCP server configuration in `mcp.json` with URL and API key. [ 00:05:27 ]
- Download: The binary version of the Grafana MCP server is downloaded from its GitHub repository.
- Loki MCP Server [6:07]:
- Cloning Repository: The
grafana/loki-mcp-serverGitHub repository is cloned to the local machine.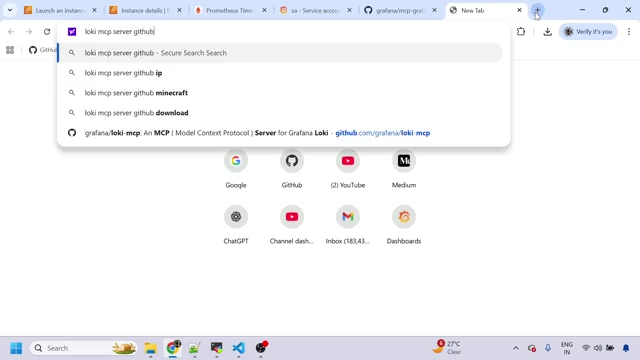
Google search for Loki MCP server GitHub repository. [ 00:06:28 ] - Command Configuration: The
mcp.jsonspecifies thego run .command to start the Loki MCP server, pointing to the EC2 instance's Loki endpoint (on port 3100). The working directory for this command must be the cloned Loki MCP server repository.
- Cloning Repository: The
- Prometheus MCP Server [7:10]:
- Cloning Repository: The
pablomd1997/prometheus-mcp-serverGitHub repository is cloned. - Python Setup: Since it's a Python-based server, a virtual environment is created, and
uvis installed. - Command Configuration: The
mcp.jsonincludes the Python command to run the Prometheus MCP server, providing the Prometheus URL on the EC2 instance (on port 9090).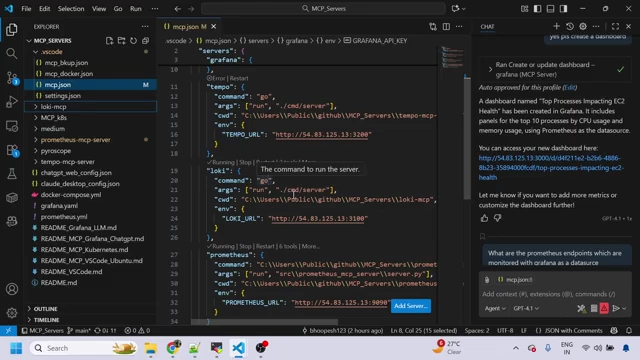
MCP JSON configuration for Loki and Prometheus servers. [ 00:06:55 ]
- Cloning Repository: The
- Tempo MCP Server (Mentioned) [7:48]: Although not demonstrated for simplicity, the speaker mentions that Tempo can also be installed on the EC2 instance and configured similarly.
- Overall Goal: With these local MCP servers configured, they can now act as intermediaries for GitHub CoPilot to interact with the respective observability tools on the remote EC2 instance.
Automating Observability with GitHub CoPilot [8:10]
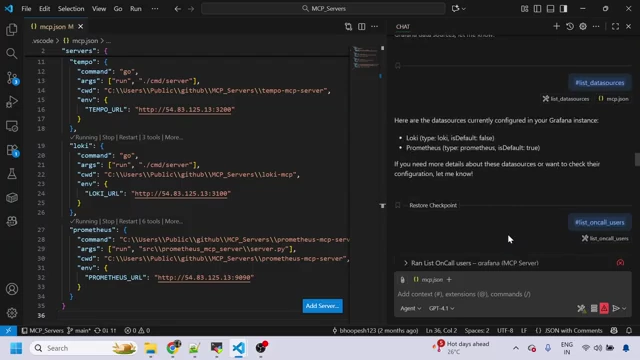
The most significant part of the demonstration involves using GitHub CoPilot to automate various observability tasks by sending natural language commands.
- Updating Node Exporter Dashboard [8:39]:
- Command: The user asks CoPilot to "update my node exporter dashboard with grafana as a data source."
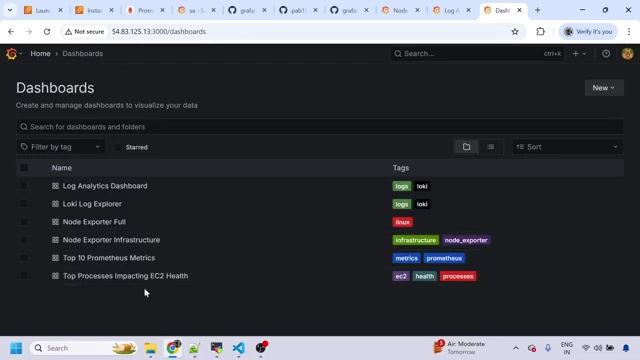
- Result: CoPilot successfully processes the request, gets dashboard details, and updates the infrastructure dashboard in Grafana.
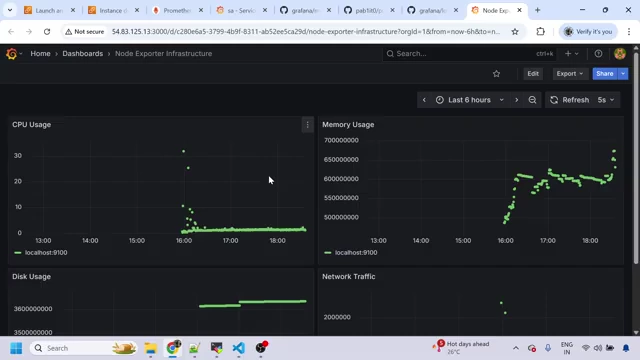
Grafana "Node Exporter Infrastructure" dashboard created by GitHub CoPilot. [ 00:09:21 ]
- Creating a Log Dashboard [9:33]:
- Command: The user asks CoPilot to "create a dashboard for logs using grafana as a data source."
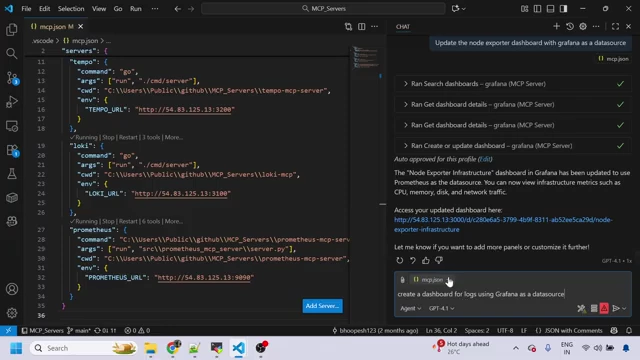
GitHub CoPilot command to create a logs dashboard in Grafana. [ 00:09:48 ] - Result: CoPilot creates a new Loki log explorer dashboard in Grafana.
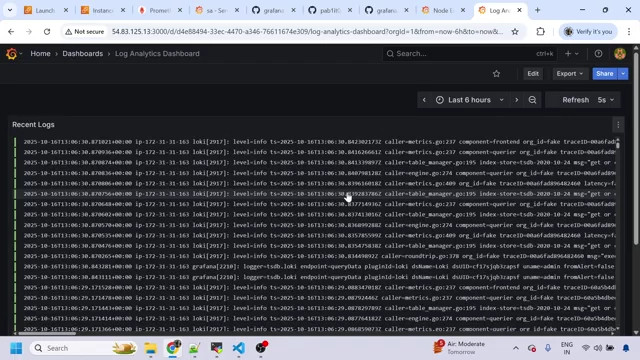
Grafana "Log Analytics Dashboard" showing collected logs. [ 00:10:30 ]
- Command: The user asks CoPilot to "create a dashboard for logs using grafana as a data source."
- Creating a Top 10 Prometheus Metrics Dashboard [10:40]:
- Command: The user asks CoPilot to "fetch top 10 matrices from from etss as a data source and create a dashboard in grafana."
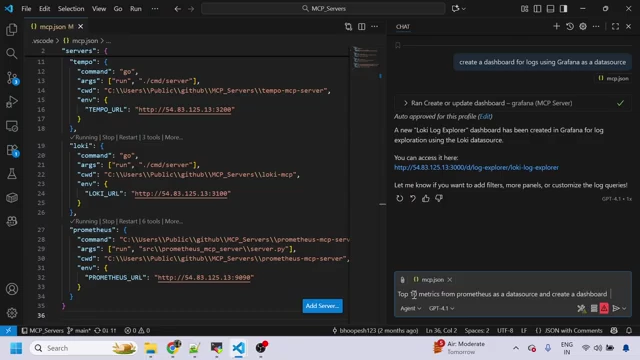
GitHub CoPilot command to create a dashboard for top 10 Prometheus metrics. [ 00:10:57 ] - Process: CoPilot first lists Prometheus metric names to identify the top ones.
- Result: A "Top 10 Prometheus Matrices" dashboard is created in Grafana.
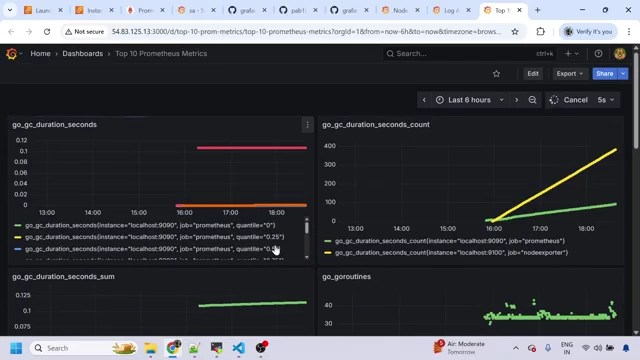
Grafana "Top 10 Prometheus Metrics" dashboard. [ 00:11:30 ]
- Command: The user asks CoPilot to "fetch top 10 matrices from from etss as a data source and create a dashboard in grafana."
- Creating an EC2 Memory Observability Dashboard [11:59]:
- Command: The user asks CoPilot to "create a dashboard which shows memory observability for EC2 instance."
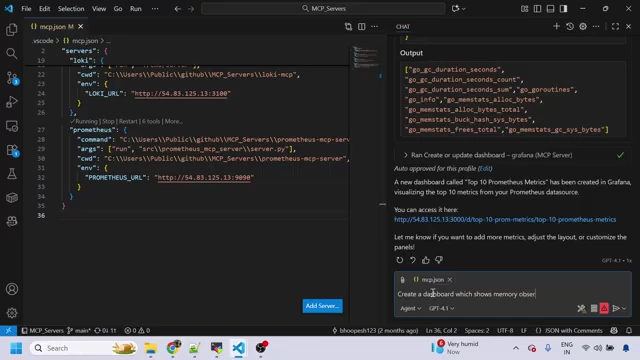
GitHub CoPilot command to create an EC2 memory observability dashboard. [ 00:12:10 ] - Result: CoPilot generates an "EC2 Memory Observability" dashboard in Grafana.
- Command: The user asks CoPilot to "create a dashboard which shows memory observability for EC2 instance."
- Listing Grafana Users [12:57]:
- Command: The user asks CoPilot to "List users from grafana."
- Result: CoPilot reports that there is only one user in the Grafana instance.
- Listing Data Sources [13:14]:
- Command: The user asks CoPilot to "list data sources from grafana."
- Result: CoPilot identifies and lists the two configured data sources: Loki and Prometheus.
- Listing All Prometheus Metrics [13:31]:
- Command: The user asks CoPilot to "list all the matrices that are there in Prometheus data source."
- Result: CoPilot fetches and displays a list of all available metrics from the Prometheus data source.
- Querying EC2 Behavior (Node Exporter) [14:22]:
- Command: The user asks CoPilot "Can you tell me how is my EC2 is behaving from top 10 heavy processes perspective?"
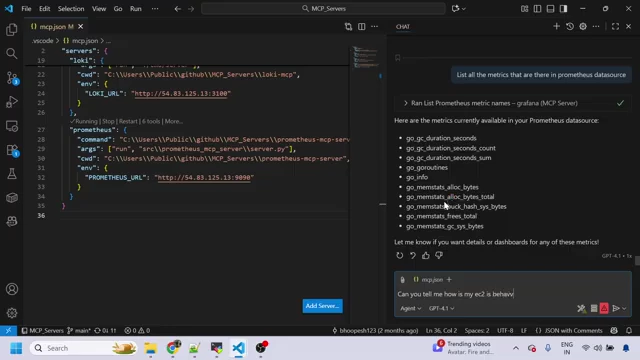
GitHub CoPilot command to query EC2 behavior from a process perspective. [ 00:14:09 ] - Interaction: CoPilot initially suggests setting up a process exporter, but when prompted to use node exporter data, it offers to create a dashboard related to important metrics from node exporter.
Grafana Dashboards list showing multiple dashboards created by CoPilot. [ 00:11:35 ]
- Command: The user asks CoPilot "Can you tell me how is my EC2 is behaving from top 10 heavy processes perspective?"
Conclusion and Future Potential [15:08]
The video concludes by emphasizing the power of this setup for simplifying complex observability tasks.
- Ease of Use: GitHub CoPilot, in conjunction with MCP servers, allows users to manage and visualize observability data using natural language, eliminating the need for deep knowledge of query languages like PromQL or LogQL.
- Automation: Dashboards and data queries can be created and executed rapidly with simple prompts.
- Scalability: This approach can be extended to other observability tools and complex production scenarios.