Understanding and Utilizing Curvature Graphs for Superior Curve and Surface Modeling in Rhino
The curvature graph is a fundamental tool in CAD software like Rhino, visually representing curvature with "combs" to analyze and improve curves and surfaces. [0:00] It helps identify areas of high/low curvature and ensures desired smoothness, revealing hidden inflections not visible to the naked eye. [0:02:45]

It is crucial for analyzing continuity between adjoining curves and surfaces, distinguishing between G0 (positional), G1 (tangent), G2 (curvature continuous), and G3 (flow continuous) relationships. [0:04:24]
- For G1, comb directions align. [0:07:34]
- For G2, comb amplitudes (endpoints) align. [0:09:34]

Curvature graph illustrating G2 continuity where the comb endpoints precisely meet at the joint of two curves. [ 00:09:30 ] - For G3, the comb slopes are continuous, making the joint appear as a single, smooth entity. [0:11:02]

Curvature graph displaying G3 (flow continuous) where the comb profile is smooth and unbroken across the joint. [ 00:12:39 ]
The video demonstrates how to manipulate control points to achieve desired curvature graph outcomes and highlights its critical role in professional workflows. [0:13:42] It helps troubleshoot common modeling issues, such as uneven surfaces or "horror shows" in lofted aerospace components, by visually exposing underlying curvature flaws. [0:15:29]

Introduction to the Curvature Graph Tool [0:00]
The curvature graph is an essential and intuitive tool for understanding and improving curves and surfaces in CAD software like Rhino. It is considered a bedrock tool, crucial for creating primary curves and surfaces, and highly useful for matching. The tool provides a visual representation of curvature, often called "curvature combs." It allows users to scale the combs and change their density to better visualize the curvature distribution.
- The curvature graph visually displays the curvature of a selected curve or surface. [0:00]
- It helps identify areas where a curve is more or less "curvy." [0:01:57]

Curvature graph showing comb lengths varying with the curve's "curviness". [ 00:02:11 ] - Users can adjust the scale and density of the curvature combs for detailed analysis. [0:01:20]
Curvature graph displayed on a simple curve with options for scale and density. [ 00:01:20 ]
- It helps identify areas where a curve is more or less "curvy." [0:01:57]
- Importance of the curvature graph: [0:00]
- It is fundamental for creating primary curves and surfaces. [0:00:21]
- It is highly valuable for matching and ensuring desired surface quality. [0:00:32]
- It helps to visually confirm if a curve's intended form (e.g., completely convex) is truly achieved, revealing hidden inflections that might not be apparent visually without the graph. [0:02:45]
Curvature Graph for Continuity Analysis [0:04:24]
The curvature graph is indispensable for analyzing continuity between adjoining curves, which directly translates to the quality of connected surfaces. Different levels of continuity (G0, G1, G2, G3) have distinct visual representations on the curvature graph.
- G0 (Positional) Continuity:
- Indicates that curves meet at a shared point. While not visually demonstrated with a specific image for G0, a sharp break in the curvature graph would be expected, showing a complete discontinuity in direction and magnitude.
- G1 (Tangency) Continuity: [0:04:30]
- Achieved when adjoining curves share a tangent direction at their meeting point. [0:04:43]
- On the curvature graph, the direction (slope) of the curvature combs at the joint needs to line up perfectly. [0:06:23]
- There can still be a complete discontinuity in the magnitude of curvature at the joint, meaning the combs might have different lengths. [0:07:37]
- Visually, the lines forming the top of the combs at the joint will appear collinear. [0:06:58]

Curvature graph showing G1 (tangent) continuity between two curves, where the comb directions align at the joint but the magnitudes are discontinuous. [ 00:05:50 ]
- G2 (Curvature Continuous) Continuity: [0:07:55]
- Involves both tangent alignment (G1) and matching curvature magnitude at the joint. [0:08:19]
- On the curvature graph, the "corners" (endpoints) of the curvature combs line up with each other, meaning both direction and magnitude are continuous. [0:09:34]
Curvature graph showing G2 (curvature continuous) where comb ends meet precisely at the joint. [ 00:09:30 ] - However, the slope of the curvature graph itself can still change abruptly at the joint, indicating a change in the rate of curvature. [0:10:13]
Close-up of a G2 continuous joint, highlighting that while comb endpoints align, the slope of the comb profile is still discontinuous. [ 00:09:42 ]
- G3 (Flow/Curvature Smooth) Continuity: [0:10:20]
- The highest level of continuity discussed, often referred to as "flow" continuity. [0:10:36]
- Requires the curvature graph itself to be tangent across the joint, meaning there is no disturbance in the curvature comb profile. [0:11:02]
- This makes the joint indistinguishable from a single, continuous curve or surface, even at a microscopic level. [0:11:51]
- Direct manipulation of control points can help achieve this: the control points closest to the joint influence continuity. The first point controls tangency, the second controls curvature, and the third point (for a degree-3 curve, or higher for higher degree curves) controls flow. [0:12:45]
Curvature graph showing G3 (flow continuous) where the comb profile is smooth and unbroken across the joint. [ 00:12:39 ]
Practical Applications in Modeling Workflows [0:15:04]
The curvature graph is critical for identifying and troubleshooting issues in complex modeling scenarios, particularly in industries requiring high-quality surfaces like aviation and marine design.
- Airfoil and Hull Design: [0:15:12]
- Common problems arise when converting airfoil coordinates into NURBS curves, often resulting in "horror shows" when viewed with a curvature graph. [0:15:29]
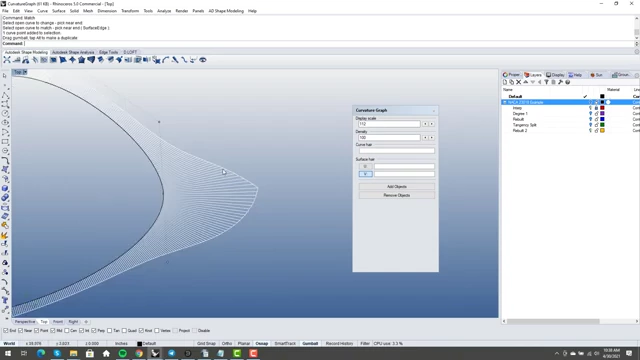
- Issues include spikes, multiple zero crossings (indicating unwanted concave/convex transitions), and wobbles, all of which indicate poor surface quality. [0:17:37]
A highly irregular curvature graph of an airfoil, indicating multiple spikes and zero crossings. [ 00:17:49 ] - Ignoring these curvature flaws leads to problems in downstream surface creation, such as wrinkly or ill-behaving surfaces (e.g., wing tip/root fairings). [0:16:04]
- A good curvature graph for an airfoil should be smooth and predictable, without sudden changes or internal zero crossings, especially crucial for composite laminar wings. [0:18:45]
- 3D Surface Troubleshooting: [0:19:32]
- When creating 3D surfaces, like a box corner, using methods like
NetworkSrfwith curvature matching, the visual result might appear smooth but the curvature graph can reveal underlying lumpiness or unevenness. [0:20:54] - A well-constructed surface will show very sane, smooth curvature combs, indicating high quality and control. [0:20:06]

Curvature graph of a well-made 3D surface, showing smooth and consistent combs. [ 00:20:09 ] - A poorly constructed surface (even one generated with G2 settings) can internally behave like multiple separate surfaces, displaying severe, spiky, and uneven curvature graphs. [0:21:38]

Curvature graph of a poorly-made 3D surface, exhibiting spiky and uneven combs, indicating internal quality issues. [ 00:21:49 ] - This illustrates why "single-span surfaces" are important for control and achieving good curvature, as they result in clean curvature graphs. [0:22:09]
- The curvature graph is the most direct way to diagnose these internal surface quality issues and confirm if a surface is acting as desired, even if visual inspection seems acceptable. [0:22:43]
- When creating 3D surfaces, like a box corner, using methods like