Ethereum's Record Short Positions, ETF Investor Losses, and Potential Stablecoin Catalyst for Price Rally
Summary:
This video analyzes Ethereum's current market dynamics, highlighting several key factors:
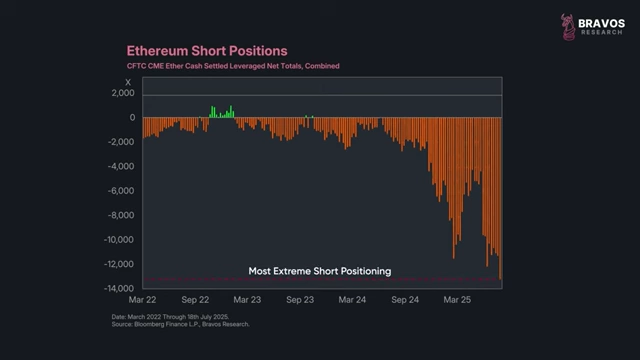
- Ethereum is currently experiencing its most extreme short positioning since March 2022, indicating a record number of traders are betting on a price decline. This setup historically precedes short squeezes, which can lead to significant price rallies.
- Ethereum ETF investors have faced considerable unrealized losses, with the average entry price around $3,500, leading to significant outflows and capitulation during price drops, especially when the price fell below their average cost in January 2025.
- Despite recent pain, Ethereum's valuation appears attractive, with its price recently touching the "realized price," a historical indicator for strong buying opportunities that has led to a 60% rally.
- The "Market Value to Realized Value (MVRV) Ratio" indicates Ethereum is not yet in an overvalued state compared to previous bull runs.
- A major potential catalyst for Ethereum's demand is the "Genius Act," proposed US legislation aimed at regulating stablecoins. With Ethereum hosting 60% of the current $240 billion stablecoin supply, a projected market growth to $3.7 trillion by 2030 (1,500% increase) could significantly boost Ethereum's usage and value.
- While short-term tariff uncertainties exist, the long-term fundamental potential from stablecoin regulation could provide the momentum for Ethereum to break its $4,000 resistance and reach new all-time highs.
Ethereum Short Positions [ 00:00:20 ] 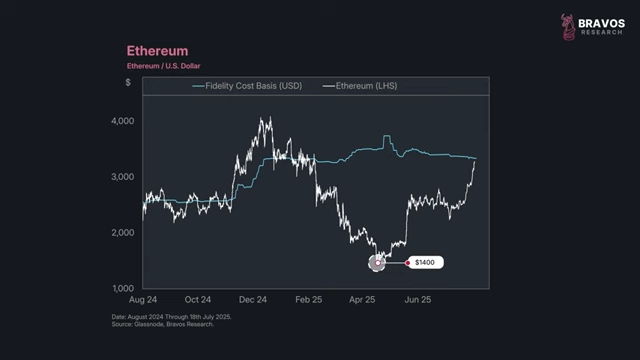
Ethereum ETF Investor Unrealized Losses [ 00:01:55 ] 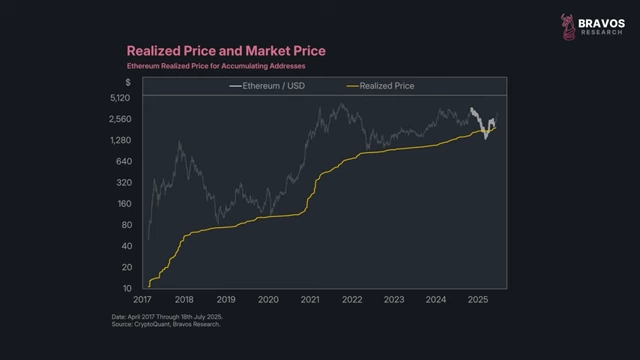
Ethereum Price vs. Realized Price [ 00:04:29 ] 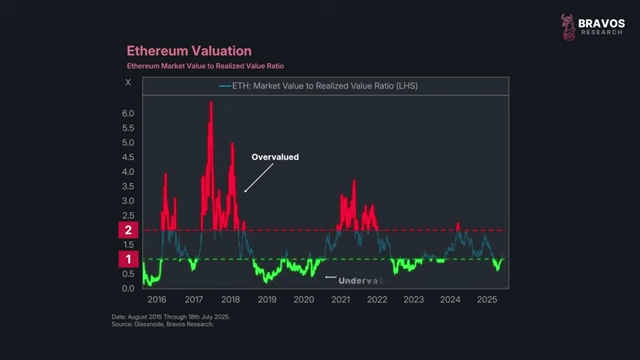
Ethereum Market Value to Realized Value (MVRV) Ratio [ 00:05:18 ] 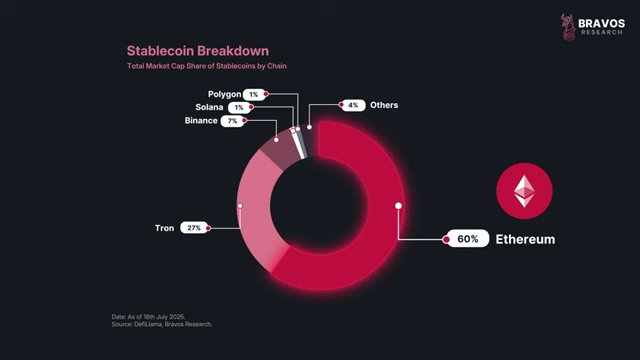
Stablecoin Distribution by Blockchain [ 00:07:27 ] 
Projected Stablecoin Market Growth [ 00:07:57 ]
Ethereum's Extreme Short Positioning and Historical Precedent [00:00:00]
- Current Trader Sentiment on Ethereum [00:00:00]
- A chart showing Ethereum Short Positions indicates how traders are positioning themselves, with green representing net long positions (expecting upside) and red representing net short positions (expecting downside).
- Currently, Ethereum is experiencing the most extreme short positioning since March 2022 [00:00:17], meaning a record number of traders are betting on a price decline.
- Historical Short Squeeze Effect [00:00:28]
- The last time similar extreme short positioning occurred was in March of 2025 [00:00:30].
- Following that period, Ethereum rallied over 100% due to a "short squeeze" [00:00:38].
- A short squeeze happens when many traders bet on a price decline, but the price starts rising, forcing them to buy back the asset to close positions, which further drives prices higher [00:00:40].
Ethereum ETF Investor Behavior and Capitulation [00:01:05]
- Ethereum's Underperformance in the Current Bull Market [00:01:05]
- Ethereum has been a "pain trade" for many, still down about 25% from its previous all-time highs.
- This underperformance persists despite Ethereum ETFs listing on the stock market a year ago [00:01:17], which many expected to boost demand.
- Average Entry Price and Unrealized Losses for ETF Holders [00:01:29]
- Impact of Price Decline on Investor Behavior [00:02:00]
- Such significant losses can create psychological pressure, leading to capitulation, especially among newer or "weaker hands" [00:02:02].
- When Ethereum's price fell below the average entry price of $3,500 in January 2025 [00:02:30], there was a significant acceleration in outflows from Ethereum ETFs [00:02:35], indicating investors locking in losses.
Ethereum Valuation from On-Chain Data [00:03:20]
- Realized Price as a Valuation Metric [00:03:25]
- The "realized price" calculates the average price at which all circulating Ethereum was last moved on-chain [00:03:29], providing an estimate of the average entry price for all Ethereum holders.
- This metric helps gauge whether the market is broadly in profit or loss [00:03:44].
- When price dips close to or below the realized price, it often signals capitulation and attractive long-term buying opportunities [00:03:52].
- Historical instances of capitulation and subsequent buying opportunities occurred in January 2019, March 2020, July 2022, and January 2023 [00:04:04].
- Ethereum recently reached its realized price, leading to a 60% rally [00:04:27].
- Market Value to Realized Value (MVRV) Ratio [00:04:35]
- This ratio compares Ethereum's market value directly to its realized price, offering a broader view of investor sentiment and profitability [00:04:45].
- A ratio above 2 indicates that the average holder has more than doubled their money, potentially signaling an overvalued market at risk of pullback [00:05:06].
- A ratio below 1 suggests the price has fallen below the average investor's cost, indicating widespread losses and potential undervaluation [00:05:16].
- In the current bull market (since 2023), the MVRV ratio peaked at 2.35 in March 2024 when Ethereum hit $4,000 [00:05:28], representing a 135% unrealized gain.
- This current peak is well below the euphoric levels of previous bull markets (3.8 in 2021, 6.5 in 2017) [00:05:49], suggesting Ethereum is not yet extremely overvalued.
Emerging Catalysts: Stablecoin Regulation [00:06:40]
- Need for a Fundamental Catalyst [00:06:10]
- The Genius Act and Stablecoin Clarity [00:06:54]
- The "Genius Act" is proposed US legislation aimed at providing regulatory clarity for stablecoins [00:06:56].
- This is significant for Ethereum because over $130 billion worth of stablecoins (more than half of the total supply) are built directly on the Ethereum network [00:07:03].
- Ethereum currently holds about 60% of all stablecoins in circulation, making it the dominant blockchain for stablecoin infrastructure [00:07:24].
- Projected Growth of the Stablecoin Market [00:07:35]
- With regulatory clarity from acts like the Genius Act, the stablecoin market is projected to grow significantly.
- US Treasury Secretary Scott Bessent projects the stablecoin market to reach $3.7 trillion by 2030 [00:07:46], representing over 1,500% growth from current levels [00:07:53].
- Ethereum is uniquely positioned to capture a large portion of this growth due to its current dominance [00:07:58].
- Increased stablecoin activity on Ethereum translates to more transactions, fees, and demand for the Ethereum coin itself [00:08:04].
Short-Term Risks and Outlook [00:08:21]
- Tariff Uncertainty as a Short-Term Risk [00:08:21]
- Uncertainty around upcoming tariffs, potentially going into effect August 1st [00:08:28], poses a short-term risk.
- Surprises in this process could lead to a short-term sell-off in risk assets like Ethereum [00:08:34].
- However, with a trade agreement already in place with China, the risk of a major market shock is considered low [00:08:40].
- Overall Outlook for Ethereum [00:08:48]
- Regardless of tariff developments, the fundamental growth from stablecoin regulation remains a strong catalyst for increased Ethereum demand [00:08:53].
- This potential increase in demand could lead to another short squeeze [00:08:58].
- Such momentum could enable Ethereum to finally break through the critical $4,000 resistance level [00:09:05] and achieve new all-time highs in this bull run.
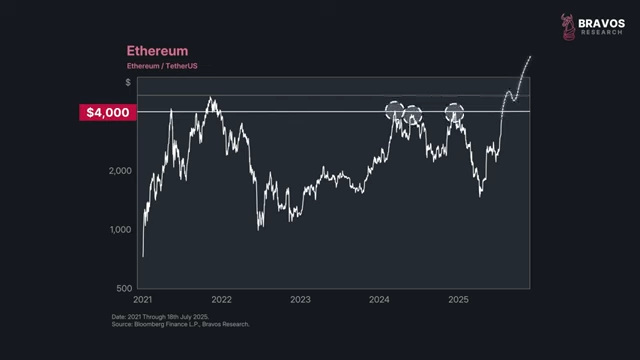
Ethereum Price Chart [ 00:09:07 ]